Health Reporting
6 minute read
Using Dashboard Reporting Features
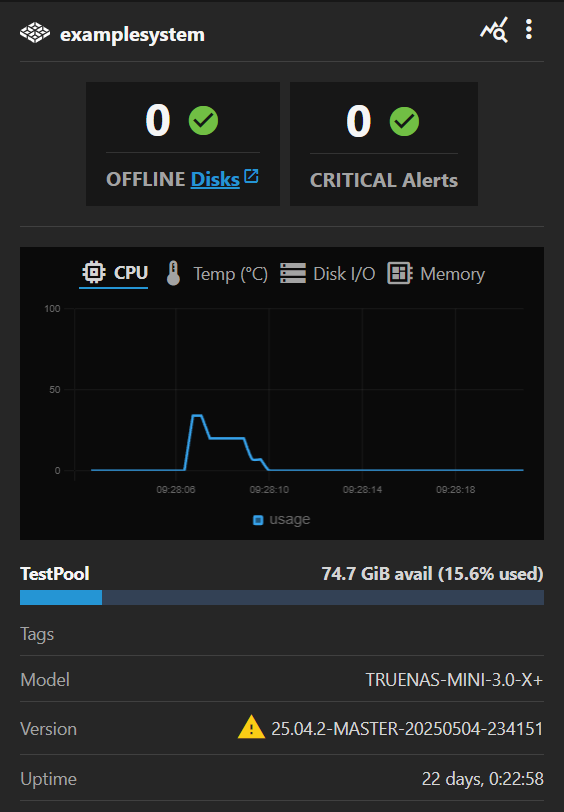
Users can find the system card(s) with health reporting widgets on their TrueNAS Connect dashboard.
OFFLINE Disks and CRITICAL Alerts statistics are found at the uppermost border of the widget, and can be used to quickly track the number of critical errors on any connected TrueNAS system.
The live-reporting graph defaults to the disk I/O rates, but can be toggled to temperature reporting, CPU usage, and memory usage by clicking the applicable icons.
Below the graph, currentl storage insights for TrueNAS datasets are shown.
Users can also locate the most recent tags, model, version, and uptime statistics on their TrueNAS systems at the bottom of the dashboard health reporting widget.
Viewing TrueNAS Alerts
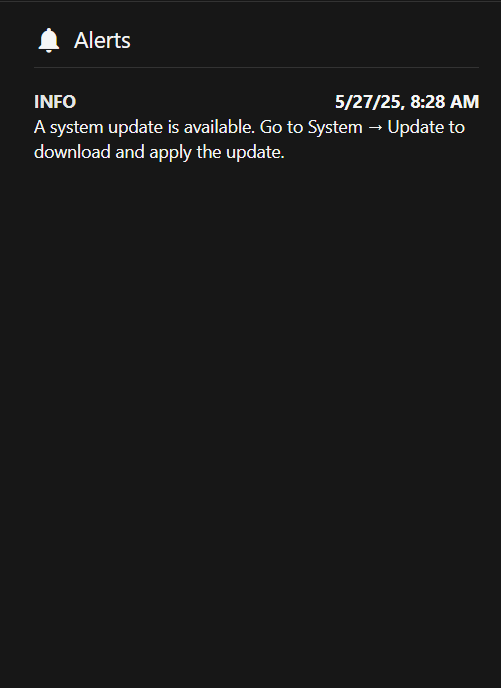
Click CRITICAL Alerts to open the alerts panel for that system. On the far right, all TrueNAS system alerts are available.
Viewing Historical Alert Data
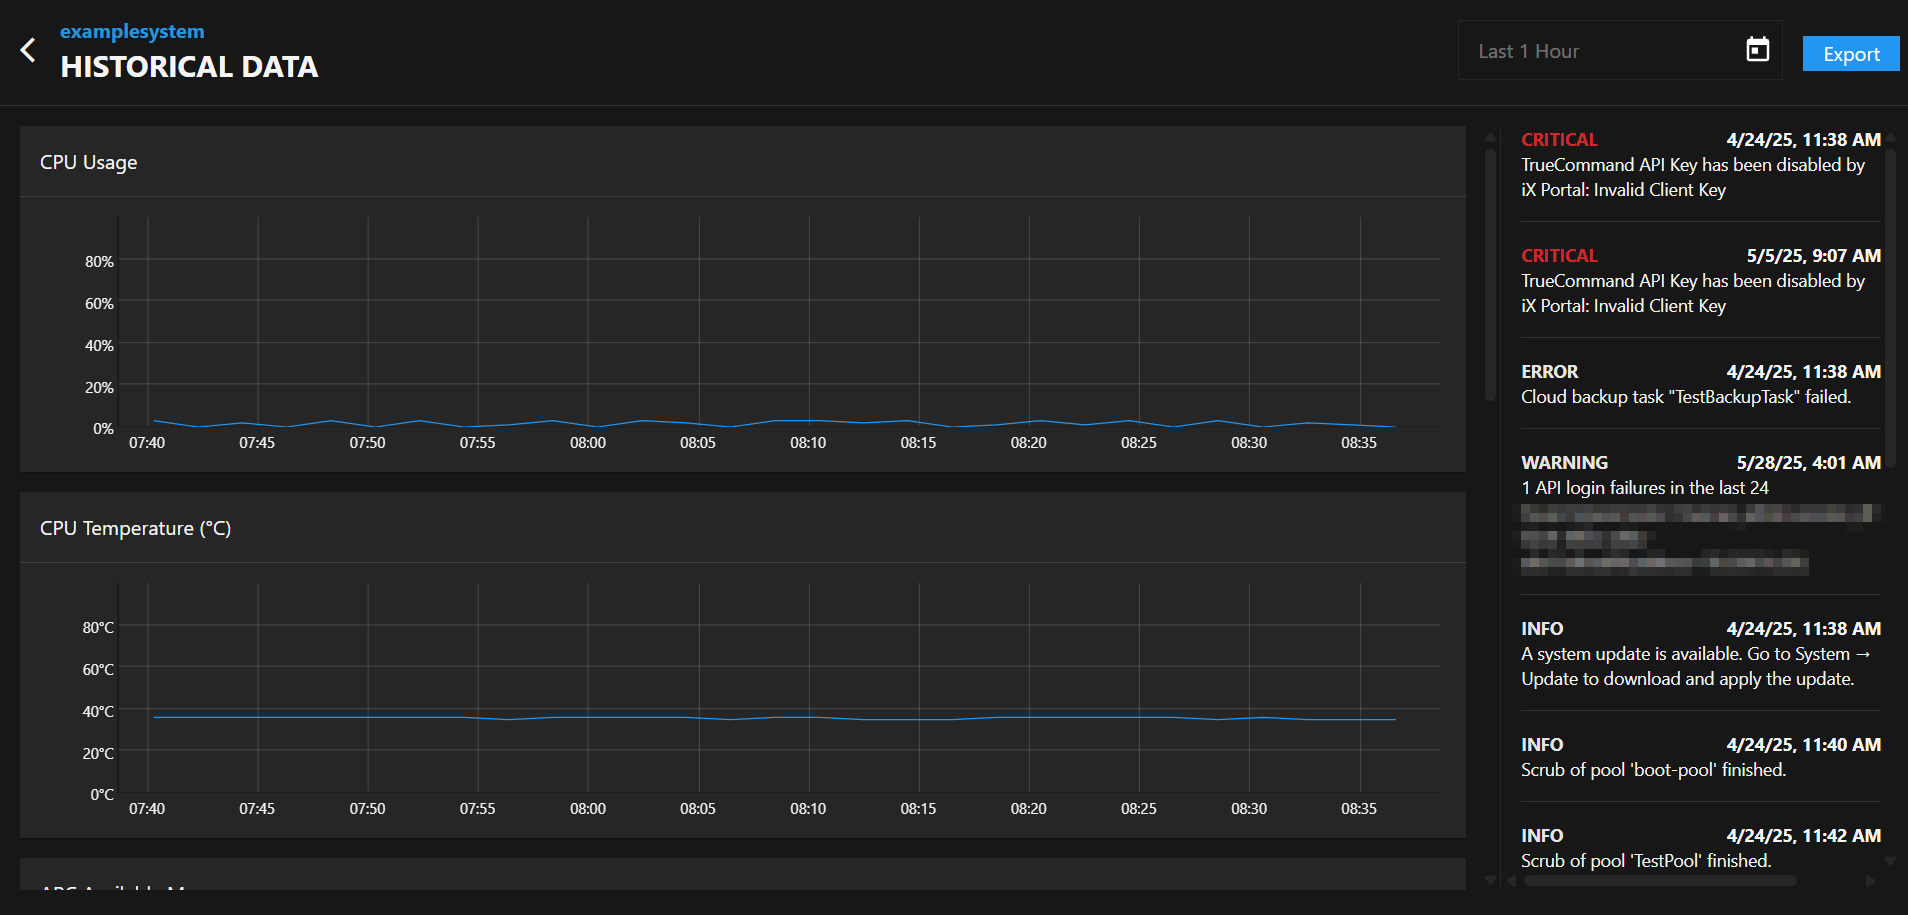
On free-tier TrueNAS Connect accounts, alerts remain in the TrueNAS Connect alert column for as long as the alerts stay in the TrueNAS UI. After alerts are cleared from the TrueNAS UI, they disappear from the TrueNAS Connect alert column.
Alert retention periods vary by account tier, with extended historical data available for higher-tier accounts. To locate system Historical Data, click on the icon located in the top right corner of the dashboard system card. From the dropdown menu, click Historical Data.
Using the System Info Screen
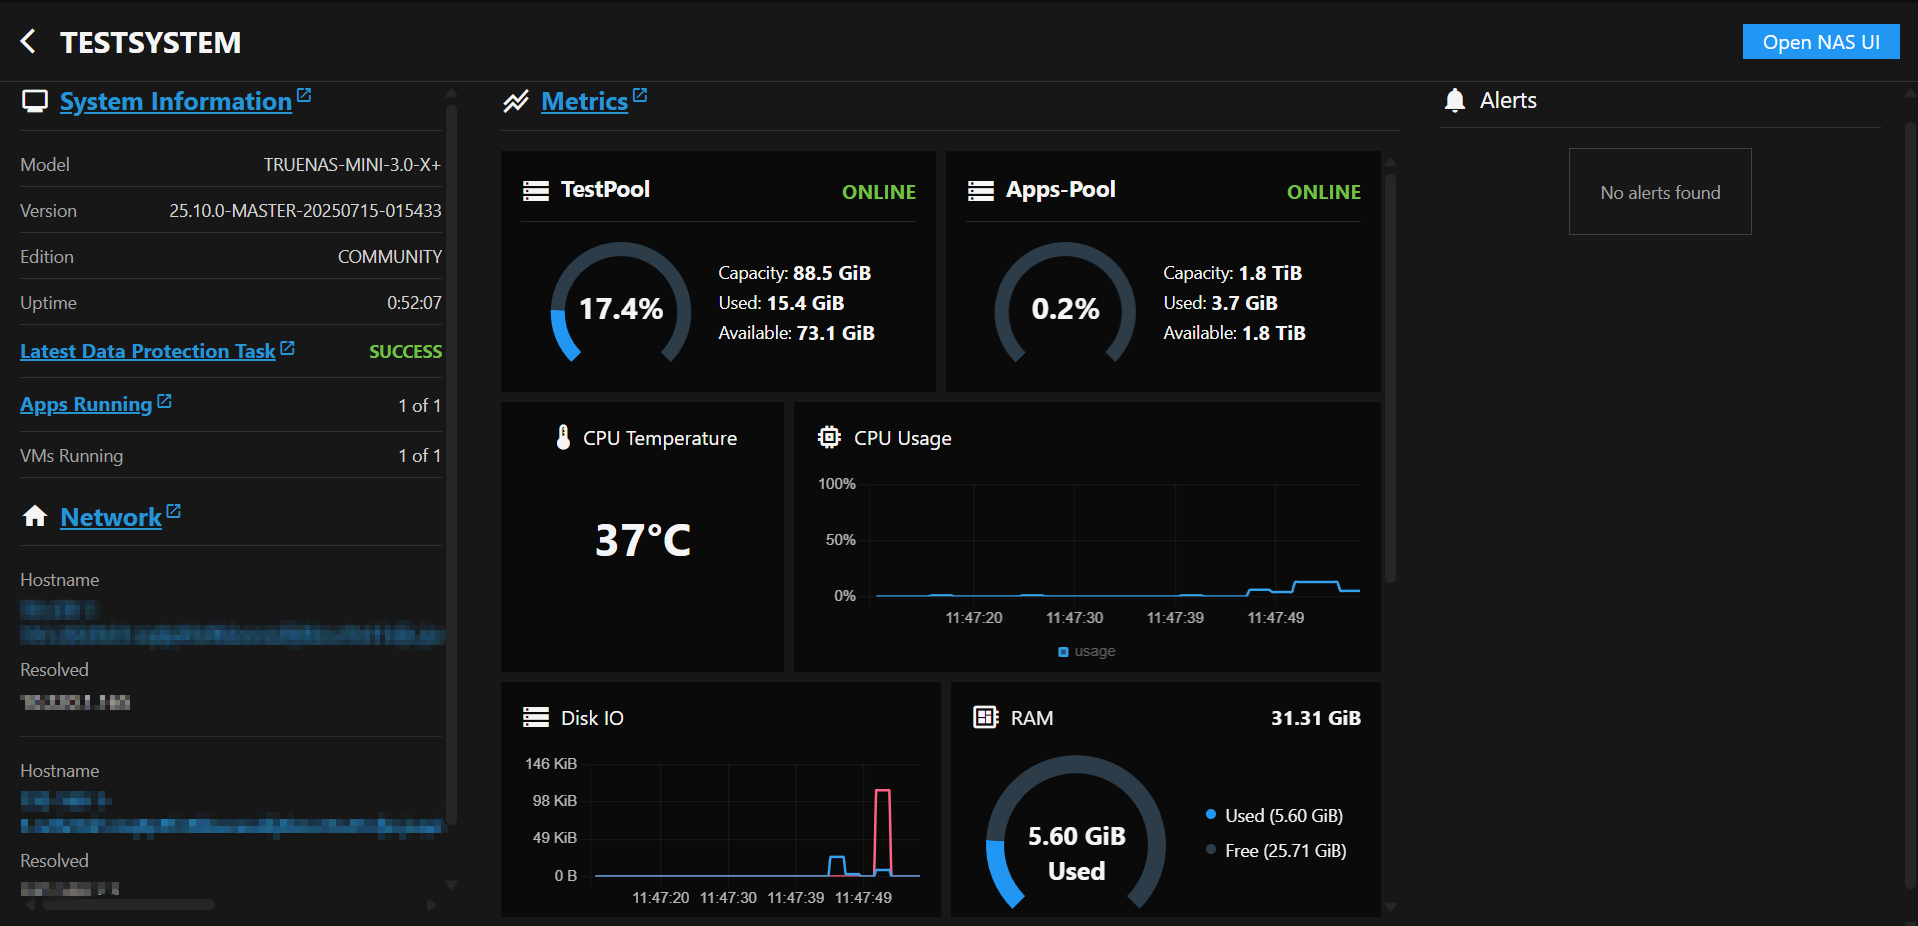
Click on the query_stats icon on a system card to go to the system info screen.
Viewing System Information
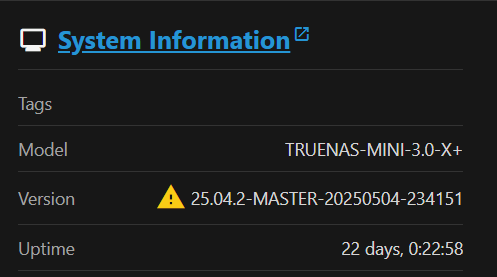
In the System Information section of the system info screen, users can find applied tags, model numbers, version numbers, and total system uptime.
Viewing Network Information
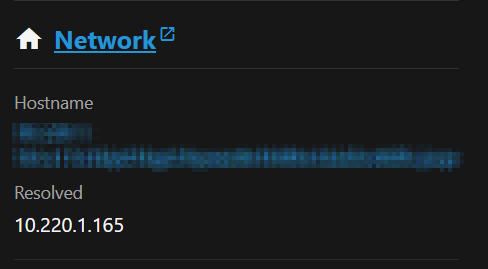
Users can also view the Network details of their TrueNAS systems from the system info screen, including the system hostname and IP address.
Viewing Metrics
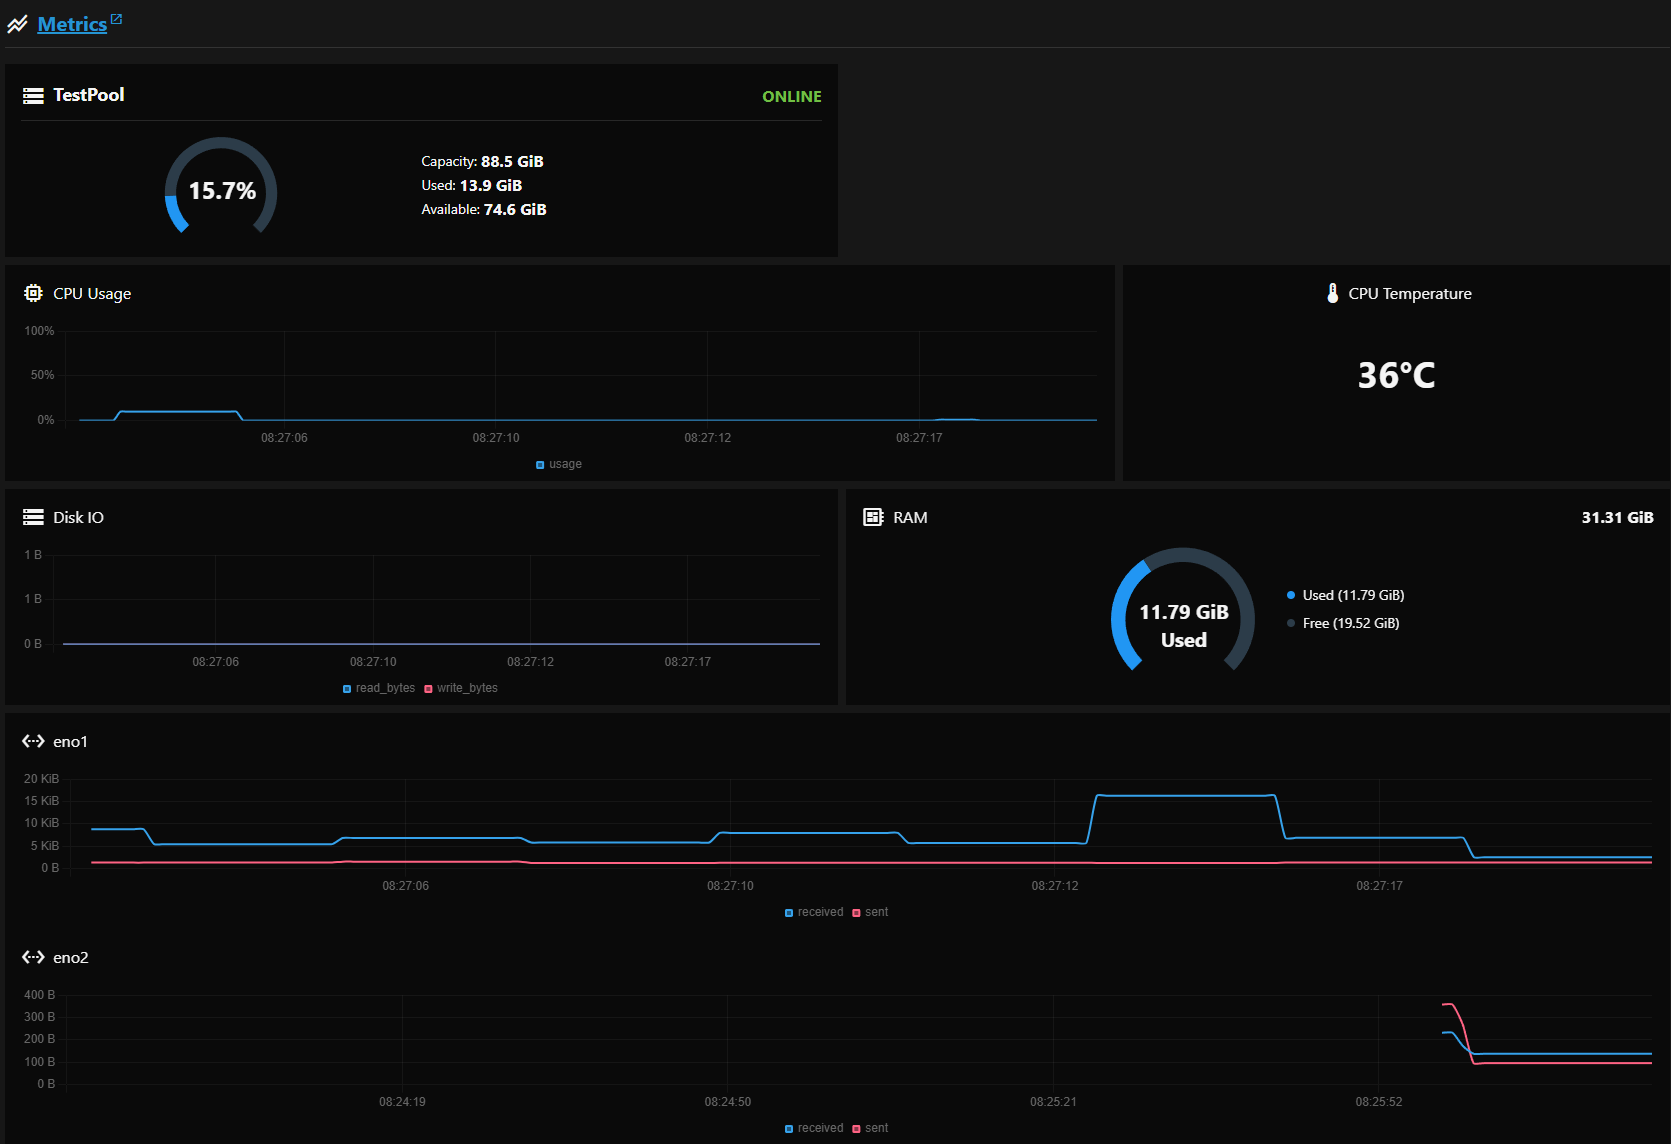
From the system info screen, users can access an expanded view of live-reporting graphs on their systems. These graphs include: memory usage, CPU usage, CPU temperature, disk I/O RAM usage, eno1 data transfer rates, and eno2 data transfer rates.
Using Notification tasks
TrueNAS Connect provides automated reporting for users through the Notification Tasks screen. To open the Notification Tasks screen, click the icon in the top toolbar to open the TrueNAS Connect side menu. Click Notification Tasks.
Viewing and Managing Notification Tasks
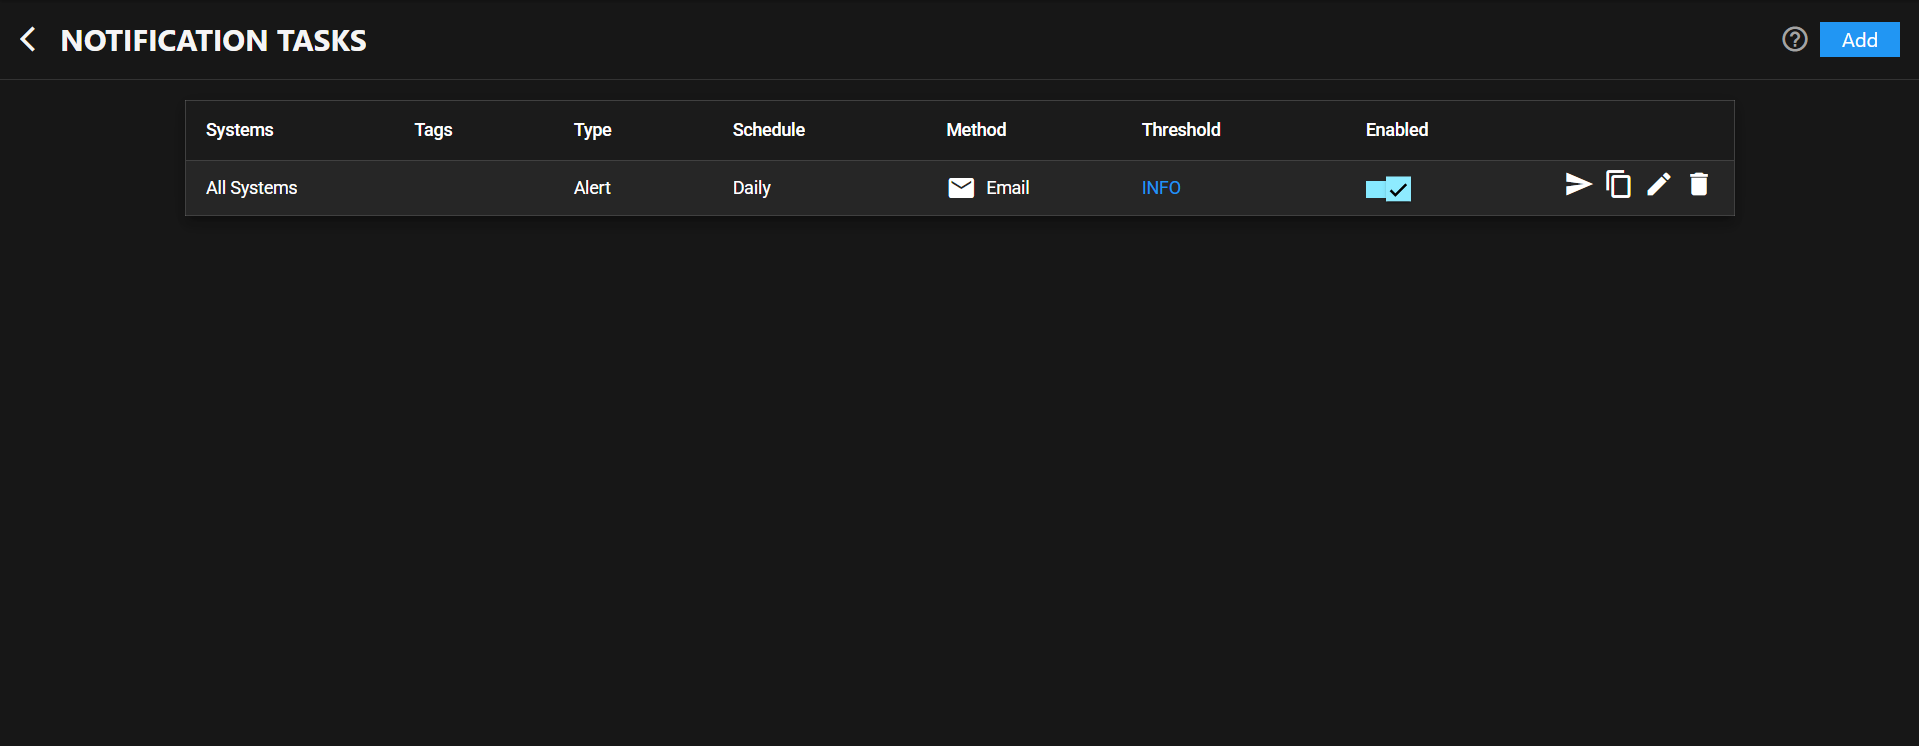
The Notification Tasks table displays all configured notification tasks.
Adding Notification Tasks
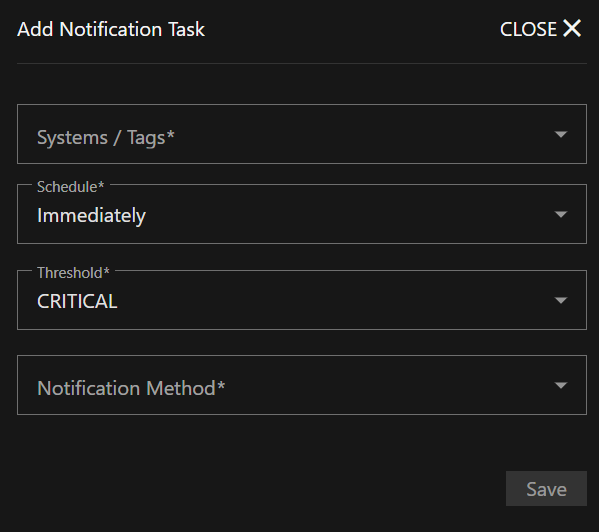
Click Add to open the Add Notification Task screen.
Notification Type
Select the type of notification to create:
- Alert - Sends notifications when alert conditions are triggered based on the threshold settings
- Report - Sends automated reports containing system performance data, storage insights, alert summaries, and predictive analysis
Schedule
Select the frequency to receive notifications for the current task.
For Alert notifications: Select Immediately to have notifications sent as soon as the alert level is triggered or select Hourly, Daily, Weekly, or Monthly to schedule periodic notifications.
For Report notifications: Select Hourly, Daily, or Weekly to schedule automated report delivery.
Threshold
Select the level of alert severity to associate with this notification task. Select CRITICAL, ERROR, WARNING, or INFO to receive notifications for all alerts at the selected level and above.
For example, a notification task set to Immediately and WARNING immediately sends notifications for all at or above the WARNING level, including ERROR and CRITICAL.
Notification Method
Select the contact type for this notification task. Options include Email, Sms text message, Slack, and Pagerduty.
Configure contact account or address details for the selected method in Notification Method Configuration.
Report Content
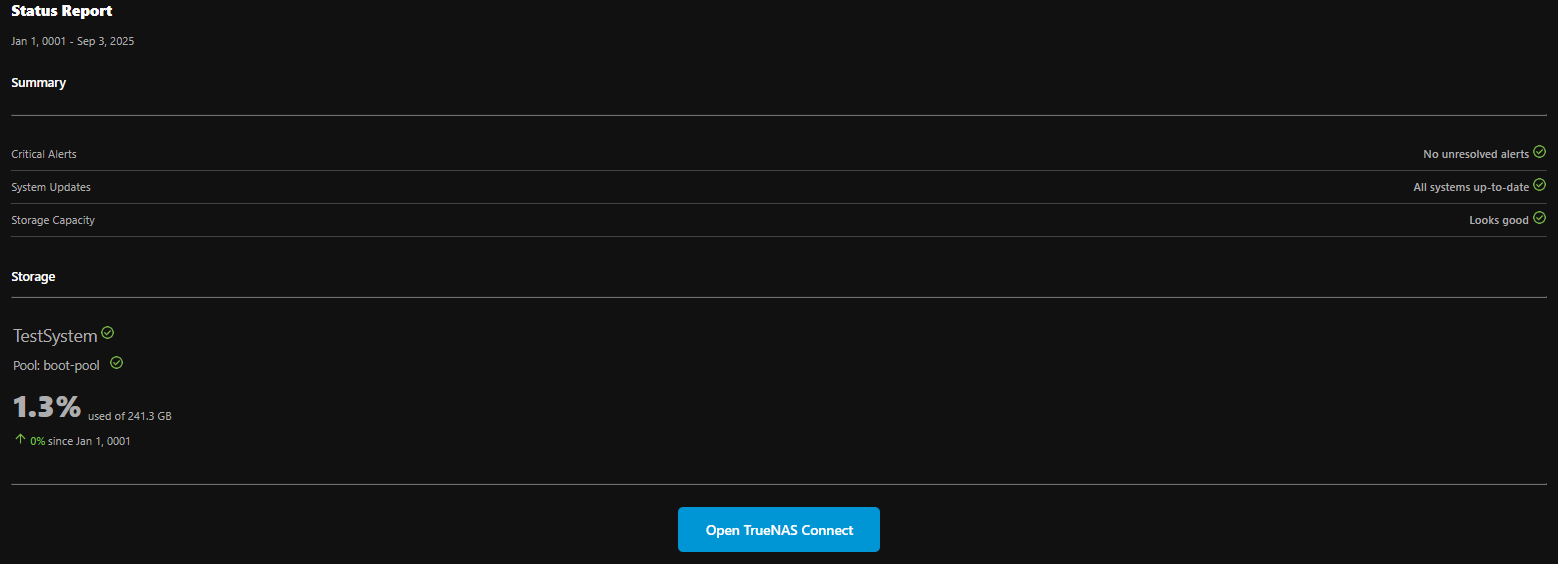
Automated reports include high-level data points useful for all user personas:
- Storage availability and usage - Pool-level storage metrics and usage trends since last report
- Predictive analysis - Forecasts when storage usage will exceed recommended thresholds
- Available updates - Notifications about TrueNAS system updates and application updates
- Alert history - Summary of critical, error, and warning alerts with resolution status
- Call-to-action link - Direct access to TrueNAS Connect interface for detailed analysis
Enterprise Customization
As users increase TrueNAS Connect tier status, reports become more customizable with additional Enterprise-tier metrics:
- CPU consumption (average and peak usage)
- Memory consumption (average and peak usage)
- Network throughput and roundtrip time statistics
- Storage latency data
- Replication status and duration metrics
- Dataset quota insights and snapshot counts
- TrueNAS access auditing (login activity)
- Critical VM uptime statistics
Configuring Automatic Email Reports
TrueNAS Connect provides automated email reports that deliver comprehensive system insights directly to your inbox. These reports offer peace of mind when systems operate within acceptable parameters and provide actionable information when performance or resource usage becomes abnormal.
To configure automatic email reports:
- From the Notification Tasks screen, click Add
- Select the systems you want to monitor from the Systems/Tags dropdown
- Choose Report as the notification type
- Select your preferred schedule (Hourly, Daily, or Weekly)
- Set the Threshold level for alert summaries to include in reports
- Choose Email as the Notification Method
- Click Save to create the automated report task
Understanding Report Contents
Automated email reports contain comprehensive data points designed to be informative and engaging for all user personas:
Standard Report Features
All TrueNAS Connect users receive reports containing:
Storage Insights: Pool-level availability and usage statistics
- Current storage utilization (e.g., 4TiB / 8TiB (50% used))
- Usage changes since last report (e.g., tank’s available storage decreased by 3.3%)
Predictive Analysis: Forecasting capabilities that help prevent issues before they arise
- Storage threshold predictions (e.g., tank’s used storage will exceed 80% in 3 months)
Update Notifications: System and application update availability
- TrueNAS version updates (e.g., A new stable TrueNAS version is available for Campbell Backup)
- Application security updates (e.g., The Plex app can be updated to address two CVEs)
Alert History: Comprehensive alert summaries
- Alert counts by severity level
- Resolution status for critical issues
- Historical alert trends
Call-to-Action: Direct link to TrueNAS Connect interface for detailed analysis and drill-down capabilities
Enterprise Customization Options
Enterprise-tier TrueNAS Connect users can customize their automated reports with additional metrics:
- Performance Metrics: CPU consumption (average and peak), memory usage statistics
- Network Analytics: Average throughput, peak roundtrip time data
- Storage Performance: Latency measurements and performance insights
- Replication Monitoring: Status updates, data volumes, and task duration analytics
- Resource Management: Dataset quota insights and snapshot count summaries
- Security Auditing: TrueNAS access logs showing login activity and timing
- Virtual Machine Health: Uptime statistics for critical VMs
Benefits of Automatic Email Reports
Automated reports serve multiple purposes in your TrueNAS infrastructure management:
- Proactive Monitoring: Receive predictive insights that help address issues before they impact operations
- Operational Visibility: Stay informed about fleet performance without actively monitoring individual systems
- Historical Context: Track trends and changes over time to understand system behavior patterns
- Actionable Intelligence: Get specific recommendations and alerts that require attention
- Streamlined Management: Access detailed information through convenient email delivery with direct links to the TrueNAS Connect interface for deeper analysis
Reports are designed to be engaging and informative regardless of technical expertise, with clear data presentation and actionable recommendations that motivate users to investigate further through the TrueNAS Connect interface.


