This is the multi-page printable view of this section. Click here to print.
Reference
- 1: Access Screen
- 2: Applications Screen
- 3: Dashboard Screen
- 4: Enclosures Screen
- 5: Historical Data Screen
- 6: Inventory Screen
- 7: Keyring Screen
- 8: Notification Tasks Screen
- 9: Profile Screen
- 10: Tags Screen
- 11: Top Toolbar
1 - Access Screen
Access Screen
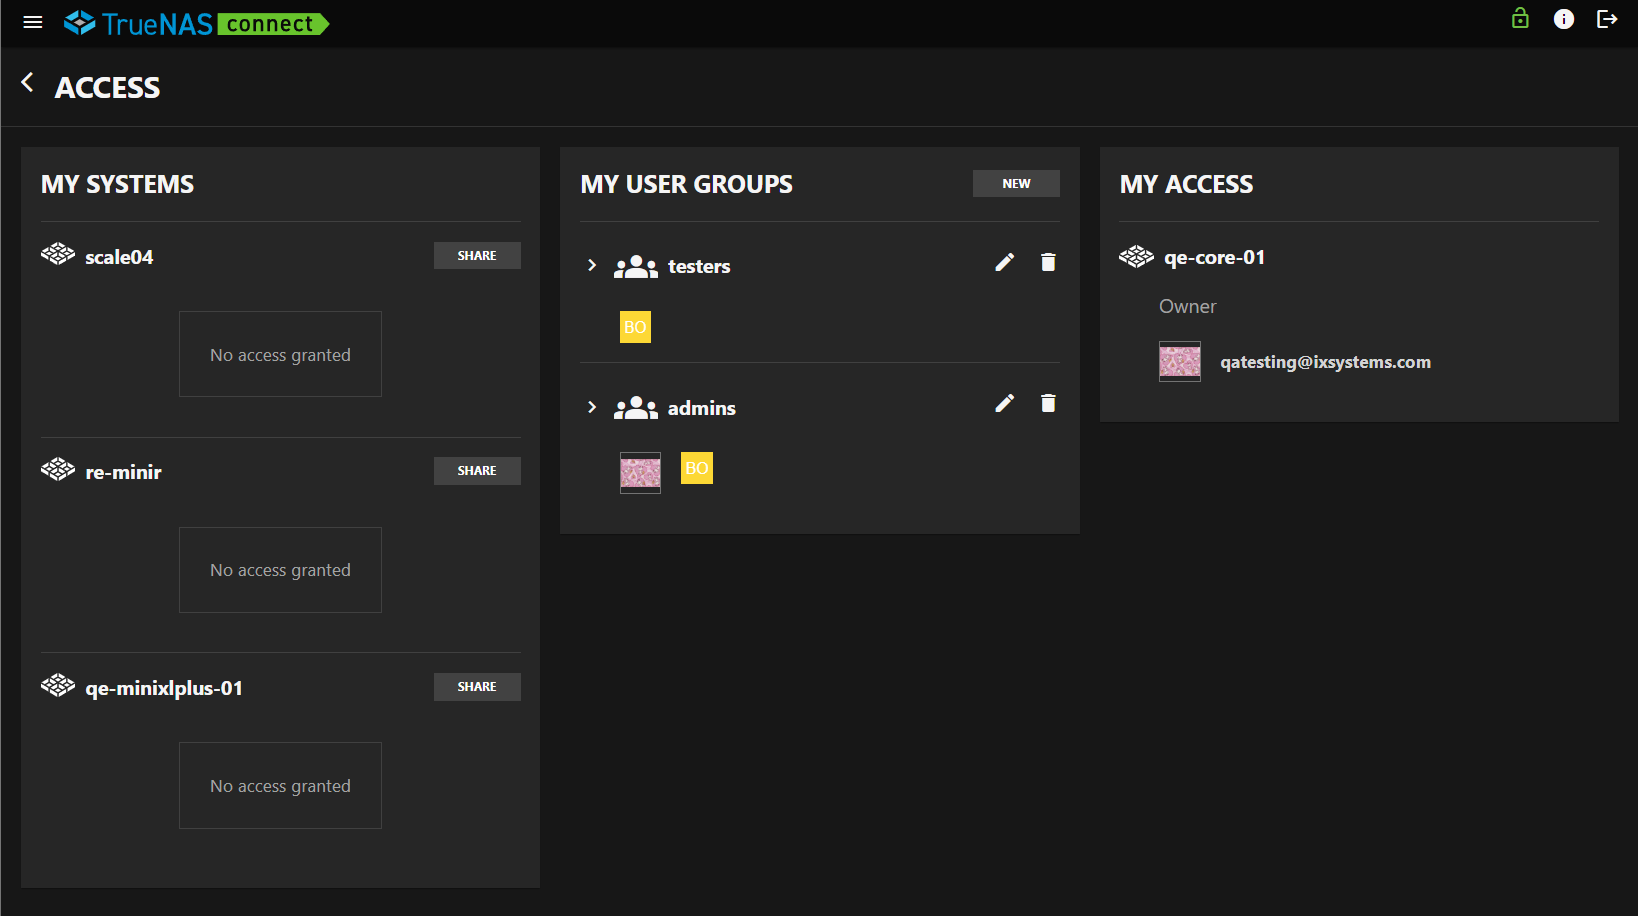
The Access screen shows systems and groups organized in three cards:
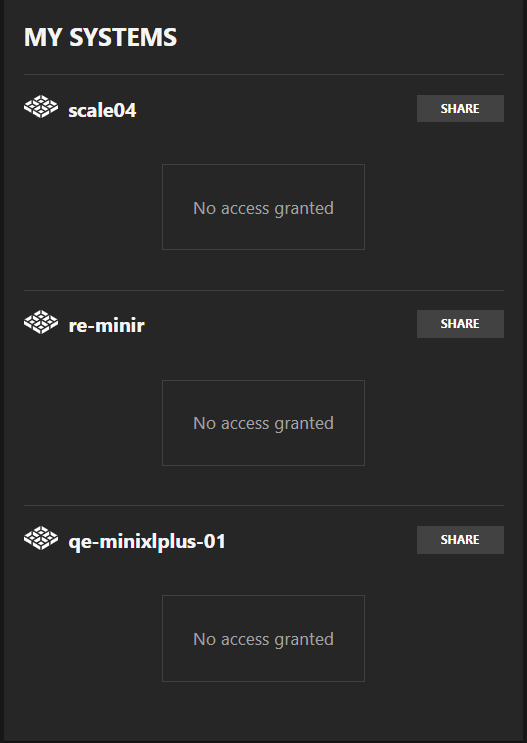
- My Systems - Shows systems in TrueNAS Connect by the logged-in account.
- My User Groups - Shows groups created on in the service by the logged-in account.
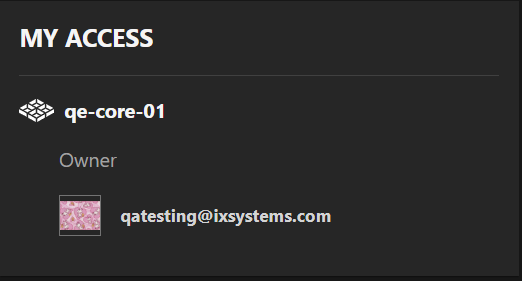
- My Access - Shows systems shared with the logged-in account.
My Systems
The My Systems card shows systems registered by or shared with the logged-in account. Shared systems are those that another TrueNAS Connect user owns or manages and invited the logged-in user to access with shared system or group permissions.
My User Groups
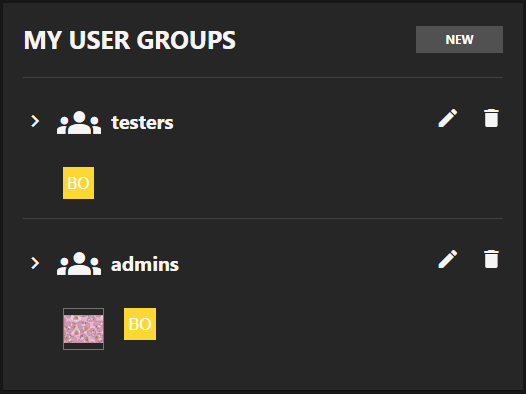
The My User Groups card lists groups added to the user account logged into TrueNAS Connect. It shows the current list of groups and the New button.
Group List Items
The My User Groups card lists individual group items added by the logged-in TrueNAS Connect account. Each listed group item includes an > expand button, the group membership icon, and the name of the group. The expanded view of the group shows the email(s) associated with the group member(s).
Edit opens the Edit Group dialog.
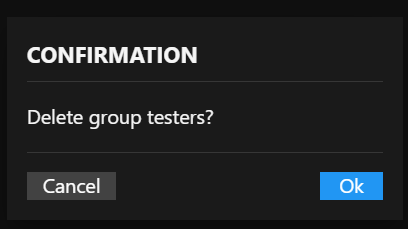
Delete opens the delete confirmation dialog.
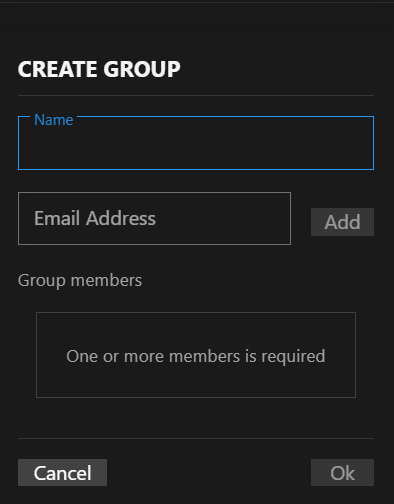
Create Group
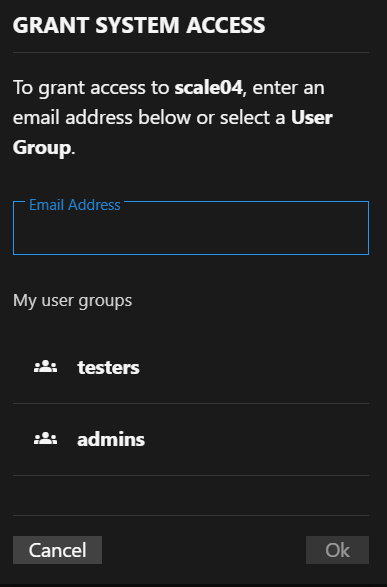
The Create Group dialog includes the Email Address input field and the Group Members area that shows group members added to the group.
Ok saves the changes made, and initiates sending the invitation to the specified email. Cancel closes the dialog without saving or sending the invitation email.
Email Address field
Email Address specifies the email address to which TrueNAS Connect sends the invitation email.
Group Member Items
The Group members area lists the email addresses added to the group, and the Delete icon that opens the delete confirmation dialog.
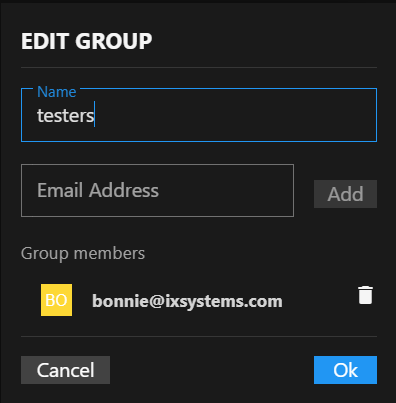
Edit Group
The Edit Group dialog shows the name of the group, the Email Address input field, the Group members area that lists group member email addresses already added to the group, and the Add button. Group members show the Delete icon button.
Ok saves the changes made, and initiates sending the invitation to the specified email. Cancel closes the dialog without saving or sending the invitation email.
Email Address field
Email Address specifies the email address to which TrueNAS Connect sends the invitation email.
Group Member Items
The Group members area lists the email addresses added to the group, and the Delete icon that opens the delete confirmation dialog.
2 - Applications Screen
The TrueNAS Connect Applications screen provides centralized management and monitoring for applications, containers, and virtual machines running on connected TrueNAS systems.
Header Controls
The header section contains navigation functionality and displays screen identification.
Apps Section
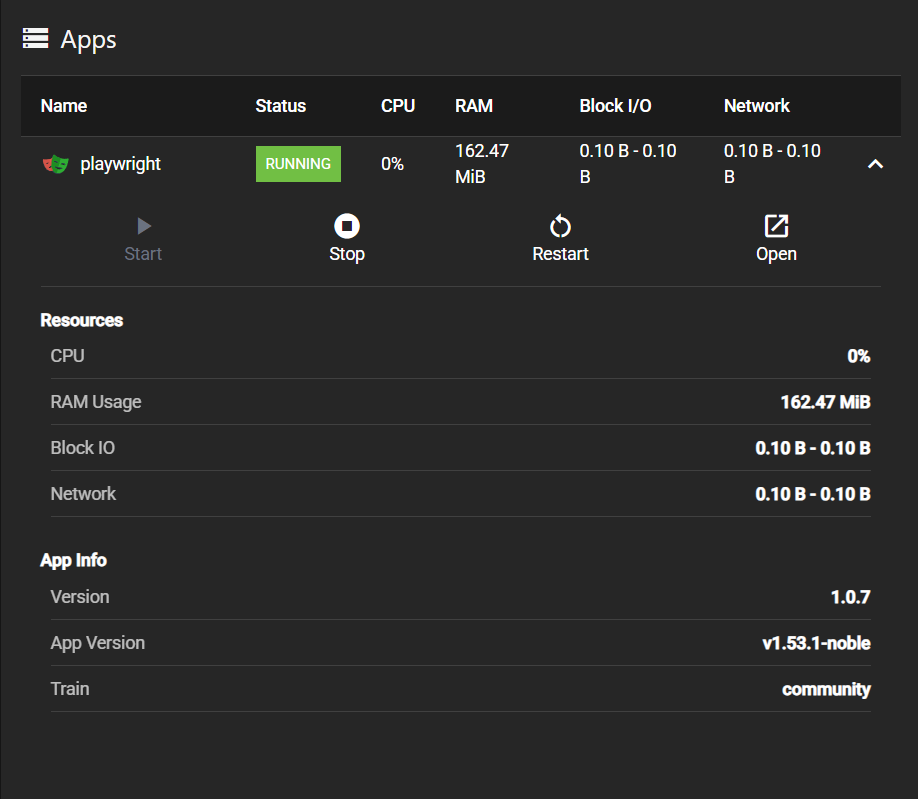
Apps displays and manages installed applications on the TrueNAS system.
Apps Table
Expandable table component displaying all installed applications with the following columns:
- Name: Application name and identifier
- Status: Current operational state of the application
- CPU: Processor utilization percentage
- RAM: Memory consumption in MB or GB
- Block I/O: Storage input/output activity metrics
- Network: Network traffic statistics for the application
The expand button in each table row reveals detailed application information and management options.
Expanded App Details
When an application row is expanded, the App Details section displays comprehensive information and management controls for the selected application.
Application Actions
Action buttons provide direct control of applications:
- Start starts a stopped application (disabled when already running)
- Stop stops a running application
- Restart restarts the application with current configuration
- Open opens the application’s web interface in a new tab
Resources Section
Resources displays real-time performance metrics for the application:
- CPU: Current processor utilization percentage (0%)
- RAM Usage: Memory consumption in MiB or GiB (159.44 MiB)
- Block IO: Storage input/output activity in bytes (0.10 B - 0.10 B)
- Network: Network traffic statistics showing inbound and outbound data (198.00 B - 198.00 B)
Containers Section
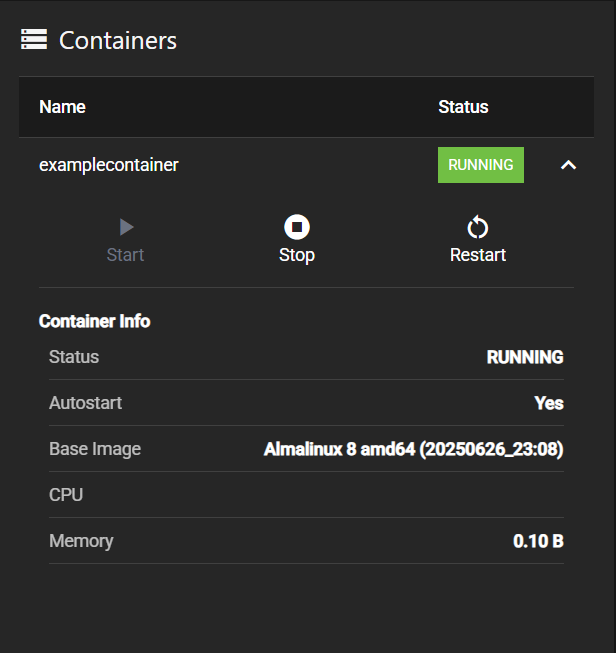
Containers displays and manages Docker containers running on the system.
Expanded Container Details
When a container row is expanded, the Container Details section displays comprehensive information and management controls for the selected container.
Container Actions
Action buttons provide direct control of containers:
- Start starts a stopped container (disabled when already running)
- Stop stops a running container
- Restart restarts the container with current configuration
Container Info Section
Container Info displays container metadata and configuration details:
- Status: Current operational state (RUNNING, ERROR)
- Autostart: Indicates whether the container starts automatically (Yes)
- Base Image: Operating system image and version (Almalinux 8 amd64 (20250626_23:08))
- CPU: Allocated CPU cores or utilization
- Memory: Memory allocation or usage (0.10 B)
Virtual Machines Section
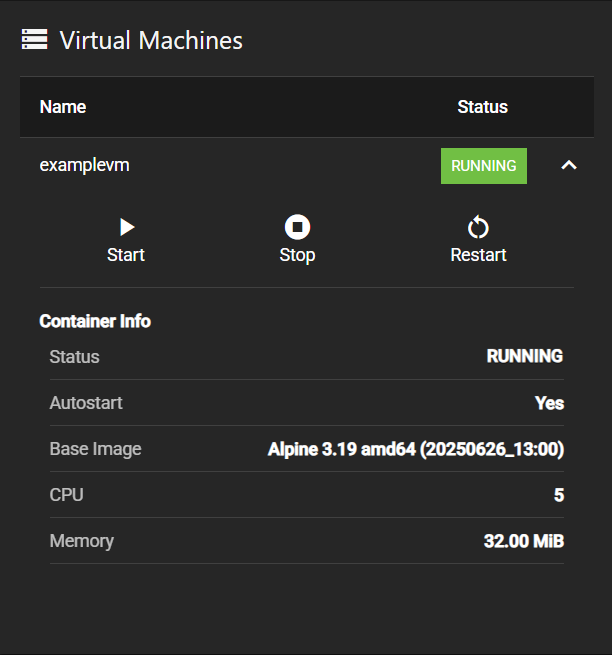
Virtual Machines displays and manages virtual machines configured on the system.
Expanded Virtual Machine Details
When a virtual machine row is expanded, the VM Details section displays comprehensive information and management controls for the selected virtual machine.
Virtual Machine Actions
Action buttons provide direct control of virtual machines:
- Start starts a stopped virtual machine
- Stop stops a running virtual machine
- Restart restarts the virtual machine with current configuration
Virtual Machine Info Section
Container Info (note: VMs use the same component as containers) displays virtual machine metadata and configuration details:
- Status: Current operational state (RUNNING, ERROR)
- Autostart: Indicates whether the VM starts automatically (Yes)
- Base Image: Operating system image and version (Alpine 3.19 amd64 (20250626_13:00))
- CPU: Allocated CPU cores (5)
- Memory: Memory allocation (32.00 MiB)
3 - Dashboard Screen
Dashboard Screen
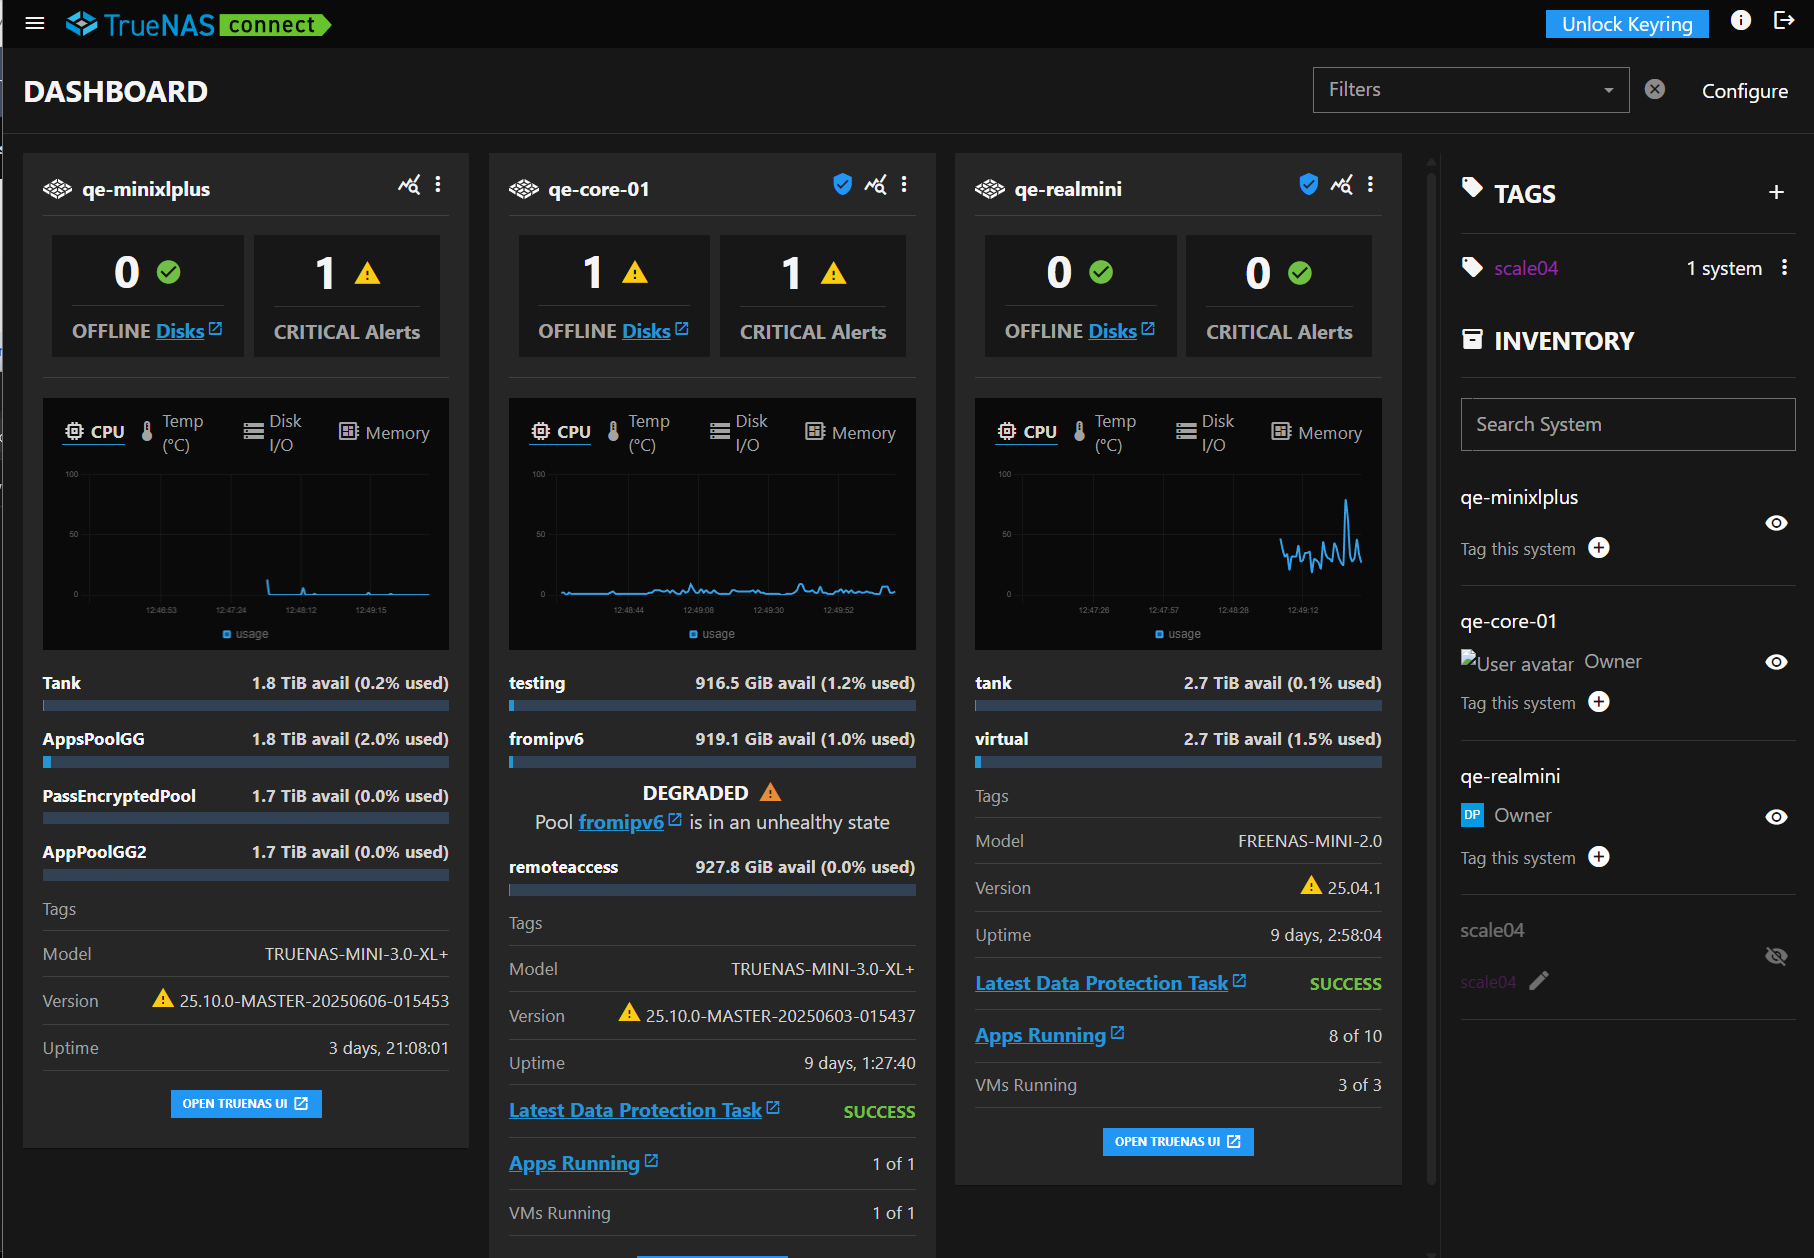
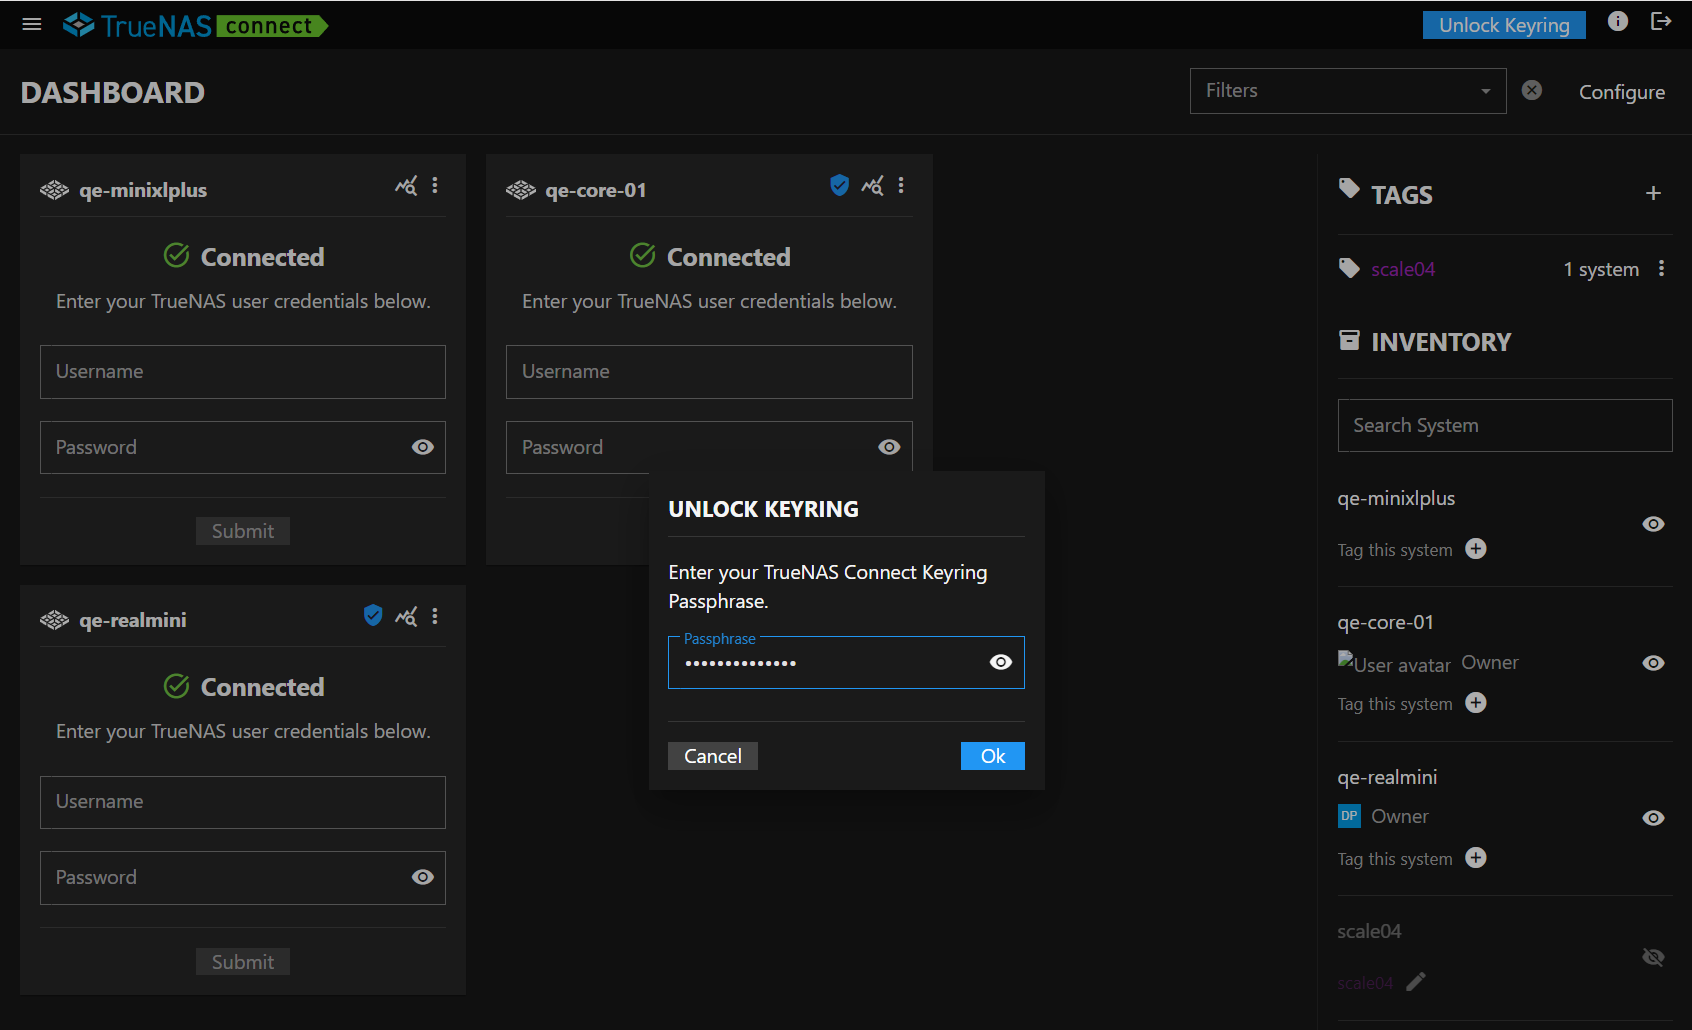
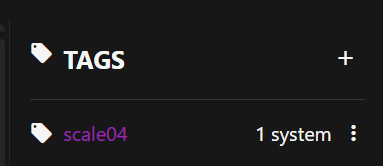
The Dashboard screen shows authentication dialogs and system cards after logging into TrueNAS Connect. After authenticating registered systems, it shows system cards populated with information on and for each system, and a side panel showing Tags and Inventory quick-access lists.
The Dashboard header shows a Filter field and Configure button.
Authentication Dialogs
After signing into TrueNAS Connect, the main Dashboard shows one or more authentication methods:
- Unlock Keyring dialog if a keyring passphrase is added
- System cards with TrueNAS system authentication credentials
After entering the keyring passphrase or TrueNAS system administration credentials, the system information cards show on the Dashboard.
The Add to Keyring option on an unauthenticated system card adds the system to the keyring authentication.
Unlock Keyring Dialog
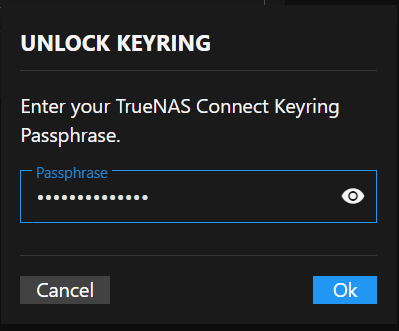
The Unlock Keyring dialog shows when you sign into TrueNAS Connect if you created a keyring to authenticate your registered (added) system.
Passphrase
Passphrase entered unlocks a system added to or covered by the keyring. Adding a keyring creates an API key between the TrueNAS server and TrueNAS Connect. To view the API key, log into the TrueNAS server as an administrator and go to the User API Key screen.
OK submits the passphrase to the system for authentication. A correctly entered passphrase unlocks all systems associated with the authentication keyring. Cancel closes the dialog without submitting the passphrase.
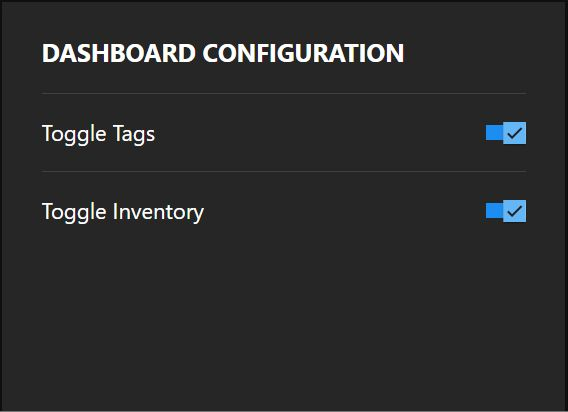
Dashboard Configuration dialog
The Dashboard Configuration dialog shows two options that determine whether Tags and/or Inventory show in the right side panel of the Dashboard screen.
Add System Dialog
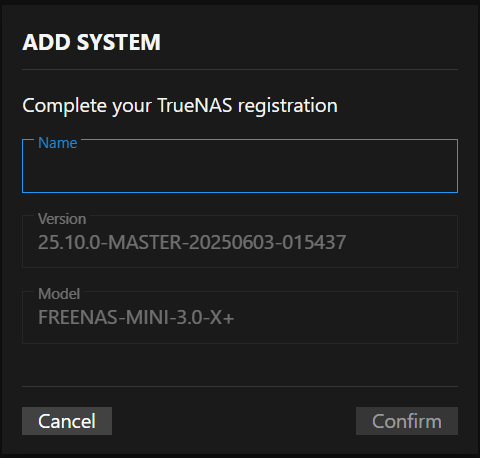
The Add System dialog shows on the Dashboard the first time you sign into TrueNAS Connect from a TrueNAS system, and prompts you to complete the system registration.
Version shows the TrueNAS release. Model shows the TrueNAS system model number.
Name
Name specifies a name for the TrueNAS system you register in TrueNAS Connect. Names can include upper and lowercase letters, numbers, and the dash (-) or underscore (_) special characters. Choose a name that helps you remember the TrueNAS system. For example, the host name assigned to the system, the system function (i.e.,backup1), or location of the system (i.e., tn-tnas1).
Confirm adds and registers the TrueNAS system as the name entered. Cancel closes the Add System dialog without adding or registering the TrueNAS system.
Filter
The Filters field at the top of the Dashboard screen shows a dropdown list of filter options. The options narrow a search of systems to those matching the selected options. Filter options are: Online, Offline, Critical Alerts, Updates, and tag names (labels) added to systems in the service.
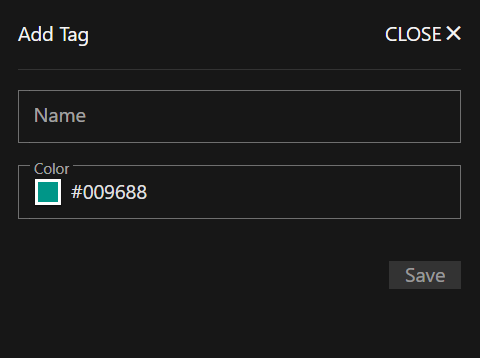
Add Tag
Use the Add Tag form to create a tag (label) in TrueNAS Connect that you can apply to systems. Applying tags to systems labels the systems according to the function, location, or any other useful information you want to use when searching for a system in TrueNAS Connect.
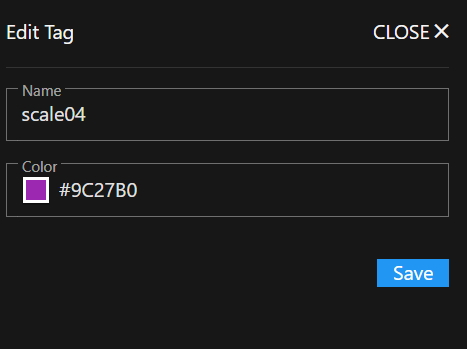
Edit Tag
Use the Edit Tag form to change the name or color assigned to a tag (label).
Edit Tag on the menu icon to the right of each tag item opens the Edit Tag form.
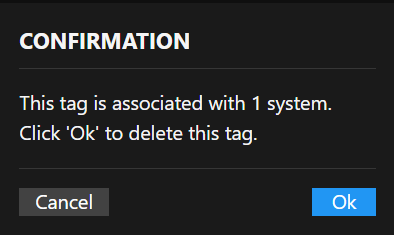
Delete Confirmation
The Confirmation dialog prompts you to verify that you want to delete the selected tag.
Delete on the menu icon to the right of each tag item listed on the Tags screen or in the Tags area in the Dashboard side panel opens the Confirmation dialog.
Ok deletes the tag. Cancel closes the dialog without deleting the tag.
Inventory
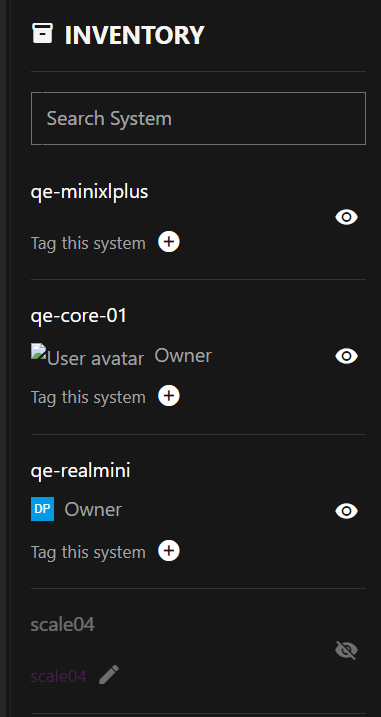
Inventory, in the Dashboard right side panel, shows individual system items for systems in TrueNAS Connect.
The add tag icon shows a list of tags added to the system that you can select and assign to the system.
The icon toggles to and back when clicked. It grays out the system item after clicking the icon, and activates it after clicking .
System Cards
System cards show information on disk status, number of critical alerts on the system, a graph with four views (CPU, Temp, Disk I/O, and Memory), information on available storage in system pools, tags applied to the system, the system model number, TrueNAS version on the system, system uptime, and links that open the TrueNAS system screens for data protection tasks, apps, and any VMs running on the system.
Open TrueNAS UI
The Open TrueNAS UI button opens the TrueNAS system main Dashboard screen. Links to the TrueNAS UI open in a new browser tab.
Disk Status
Disk Status shows the health status of system disks, and the Offline Disks links to the TrueNAS UI Disks screen in the TrueNAS UI.
Critical Alerts
Critical Alerts shows the number of critical alerts. When clicked, it opens an alert pane showing the date and time of the critical alert(s).
Realtime Graphs
Realtime Graphs shows four selectable bar graphs.
The default graph is CPU. Each title in the graph shows that graph. The graphs panel includes four graphs:
- CPU - Shows CPU usage over time.
- Temp - Shows the hottest core reading over time.
- Disk I/O - Shows read_bytes and write_bytes in Kilobytes.
- Memory - Shows memory usage over time.
The system information screen, accessed by clicking on the system name, shows more information on the measurements in these graphs.
Pool Graphs
Storage bar graphs show available storage in TiB and the percentage used for each pool. AppsPoolGG and AppPoolGG2 shows storage for applications. PassEncrypted Pool shows storage for any encrypted pools.
System Status and Information
The system status fields at the bottom of the system card:
- Tags - Shows the tag(s) applied to the system.
- Model - Shows the model number for the TrueNAS system.
- Version - Shows the current TrueNAS release for the system, and an update indicator when an update is available.
- Uptime - Shows the days, hours, minutes, and seconds from the last time the system restarted.
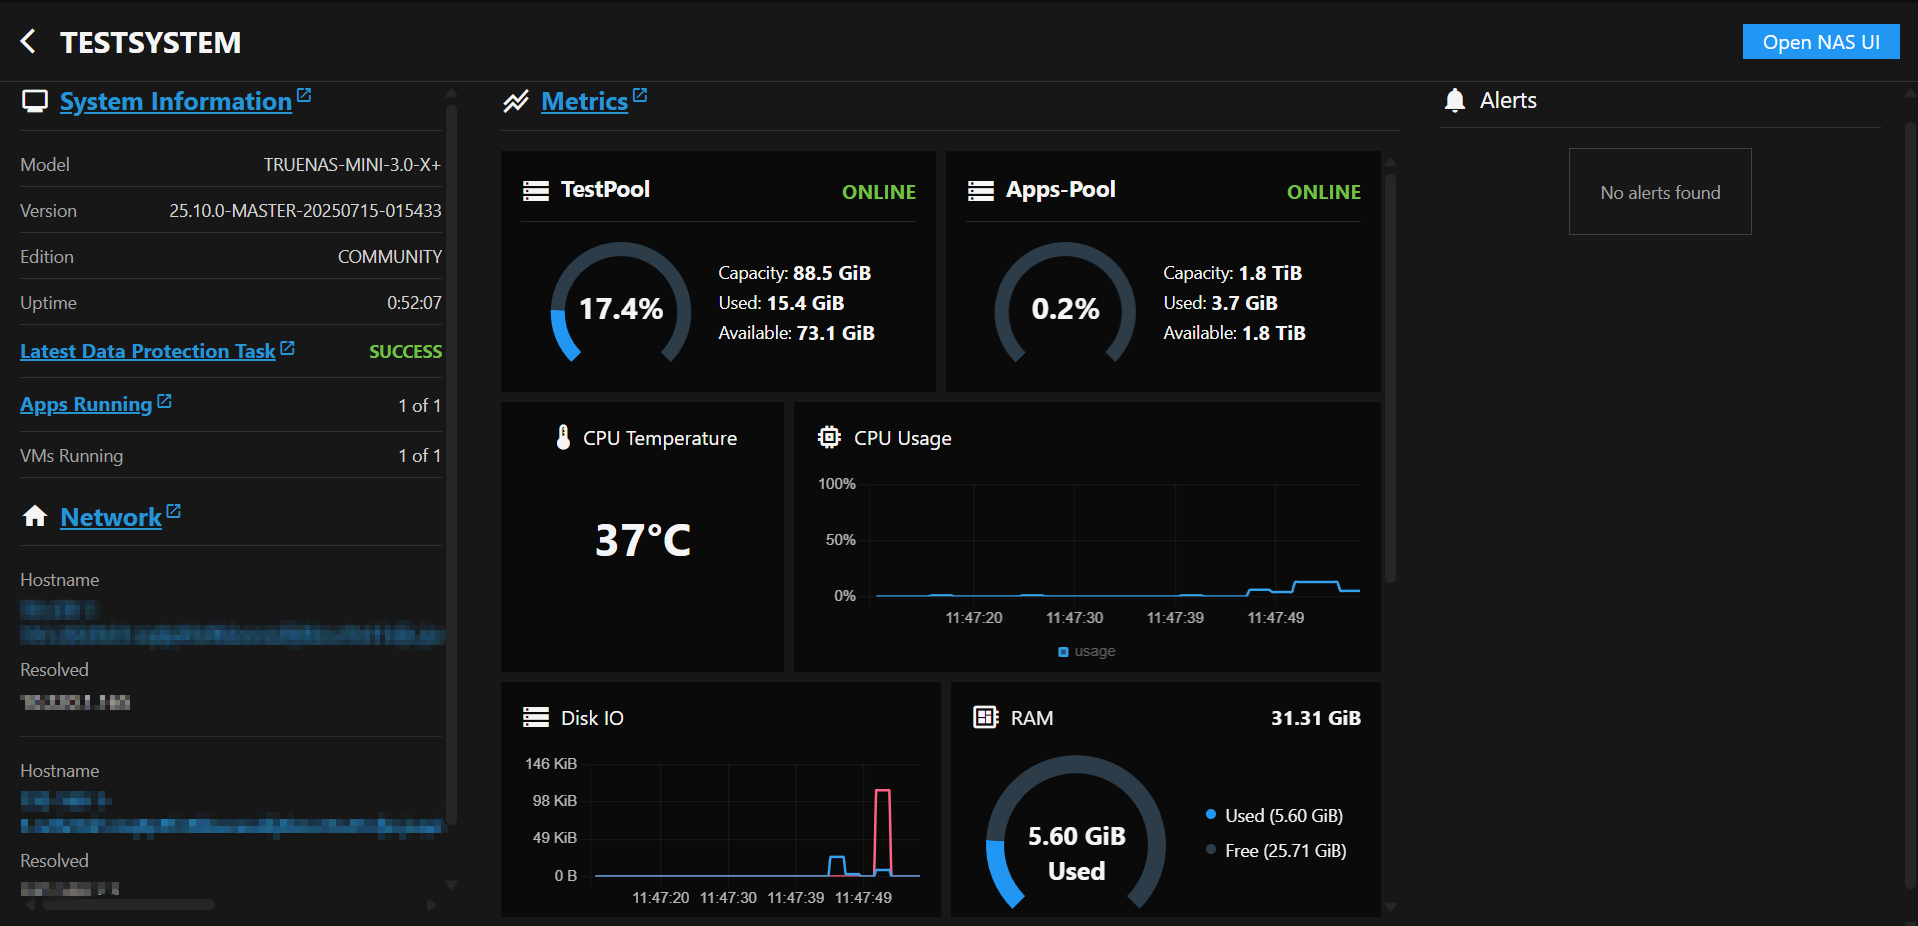
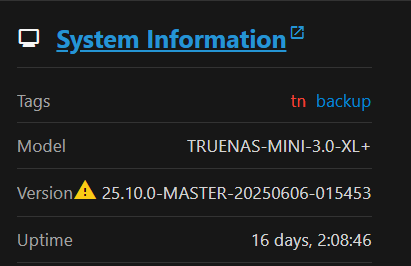
System Information Screen
The name of each system added to TrueNAS Connect opens a system information screen.
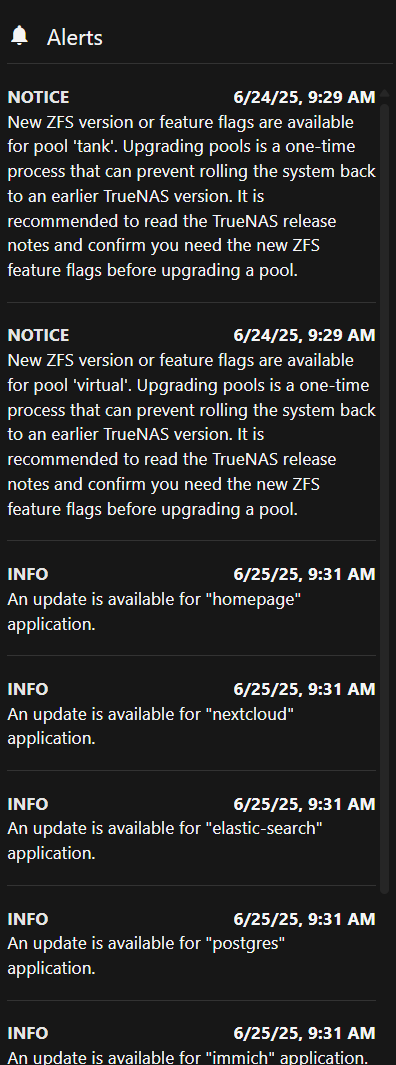
Each system information card shows four areas:
- System Information
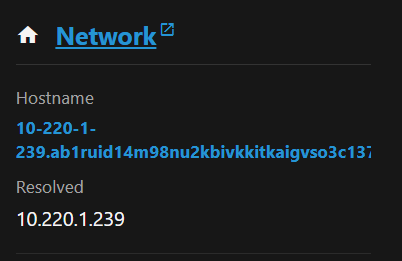
- Network
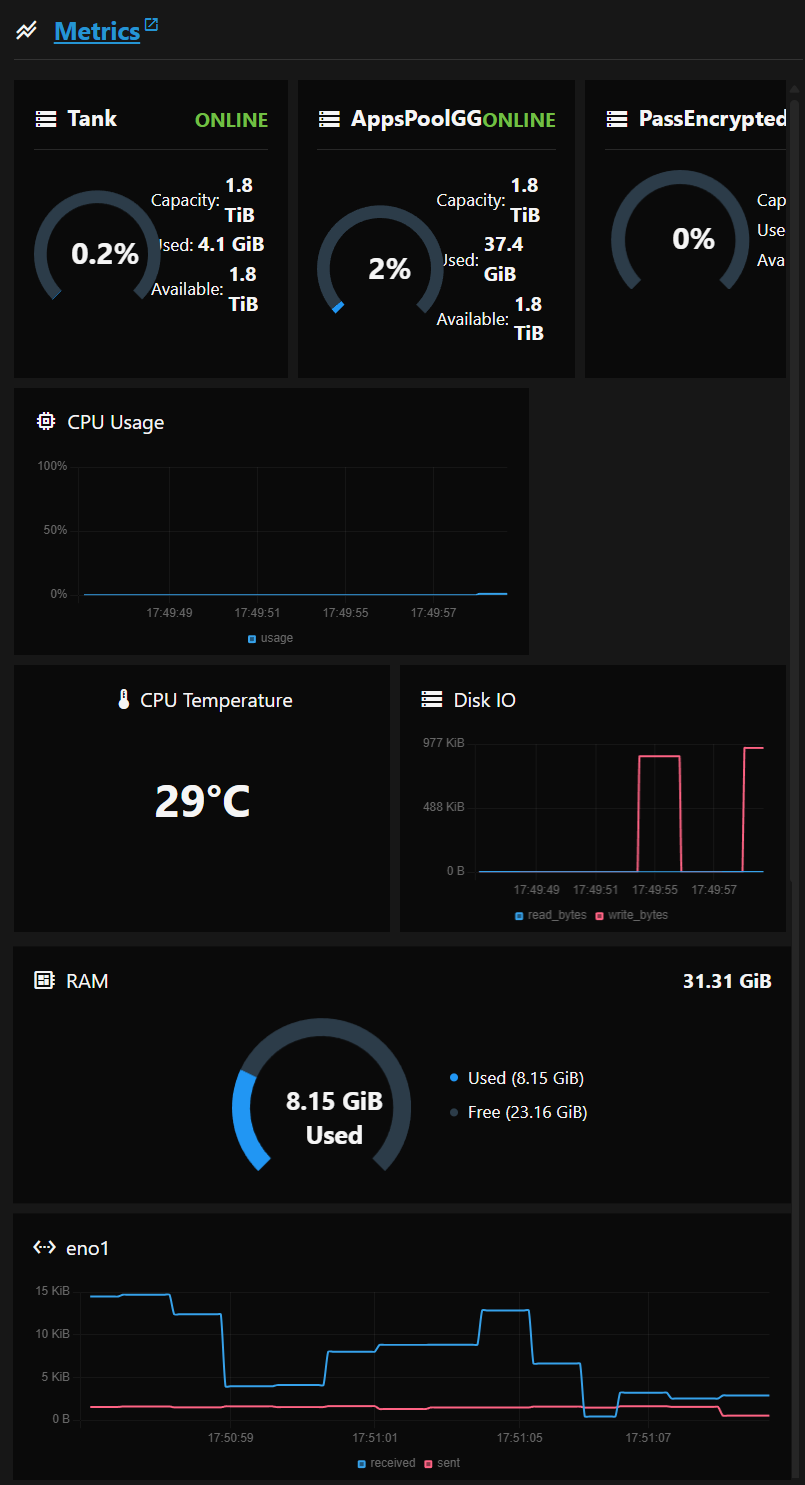
- Metrics
- Alerts
Links to the TrueNAS UI open in a new browser window.
System Information Area
The System Information link opens the Dashboard screen in the TrueNAS UI.
The system status fields in the System Information area show:
- Tags - The tag(s) applied to the system.
- Model - The model number for the TrueNAS system.
- Version - The current TrueNAS release for the system. An update badge indicates when an update is available for the TrueNAS system.
- Uptime - The days, hours, minutes, and seconds from the last time the TrueNAS system restarted.
Network Area
The Network link opens the Dashboard screen in the TrueNAS UI.
The Network widget shows two fields:
Resolved shows the IP address of the primary network interface card in the TrueNAS system that is registered in TrueNAS Connect.
Metrics Panel
The Metrics panel shows real-time graphs of storage, system, and network resources in the TrueNAS system. Note that running TrueNAS in a virtual environment can lead to incorrect or missing metric reports. This link opens the Reporting screen in the TrueNAS UI.
Pool Graphs
TrueNAS Connect shows graphs for each pool in the TrueNAS system, the status of the pools, storage capacity, percent used, and available storage measured in TiB.
4 - Enclosures Screen
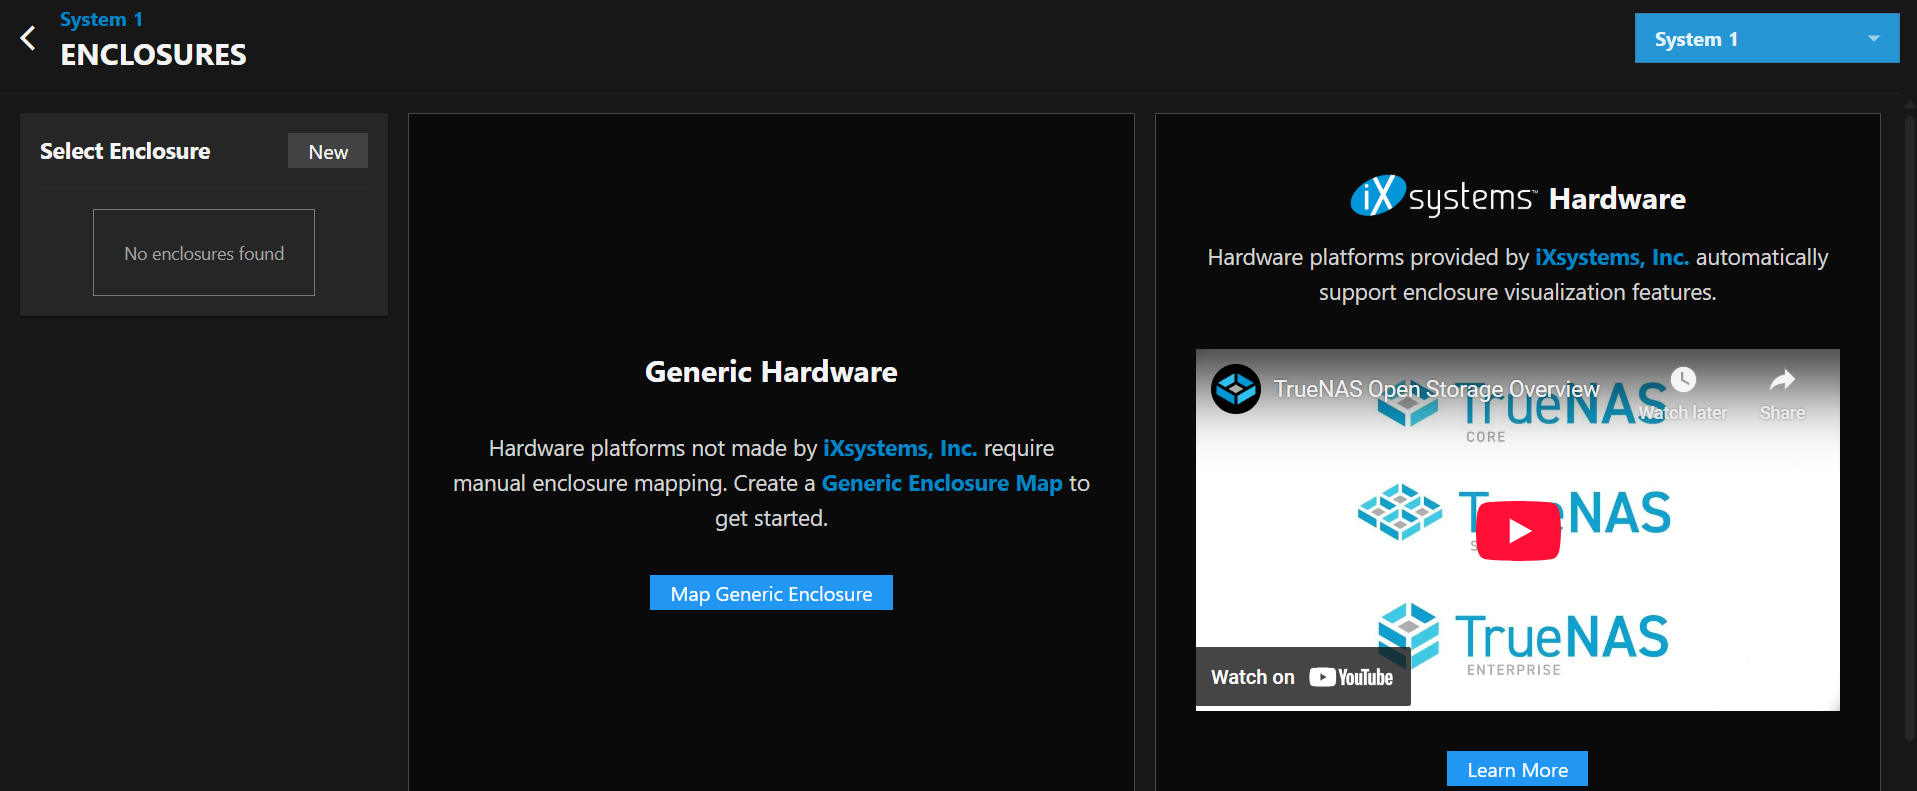
The TrueNAS Connect Enclosures screen provides detailed visualization and management of storage enclosures and their disk slots for connected TrueNAS systems.
Header Controls
The header section contains navigation, system selection, and enclosure management controls.
Enclosure Management
The main interface for viewing and managing storage enclosures.
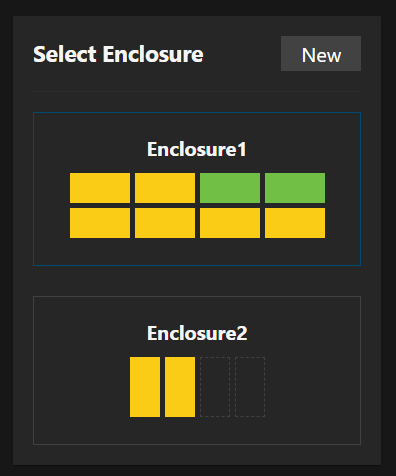
Enclosure Selector
Select Enclosure panel displays available enclosures for the current system. Contains a visual preview of the slot layout and disk status for each enclosure.
Enclosure View
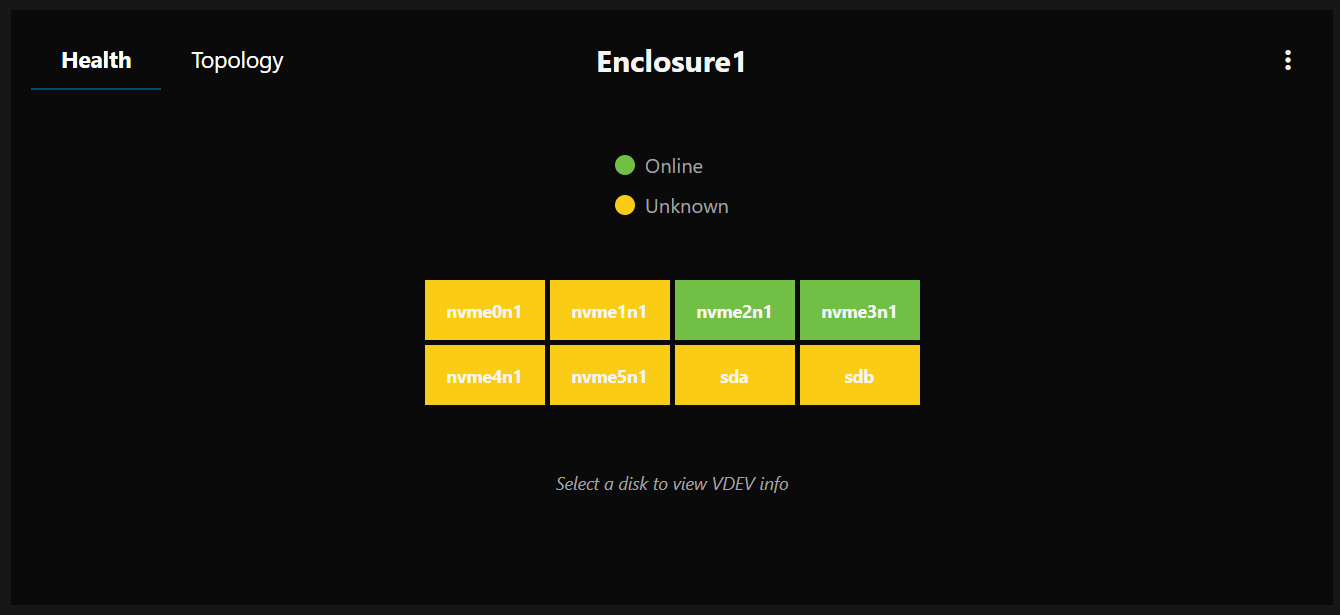
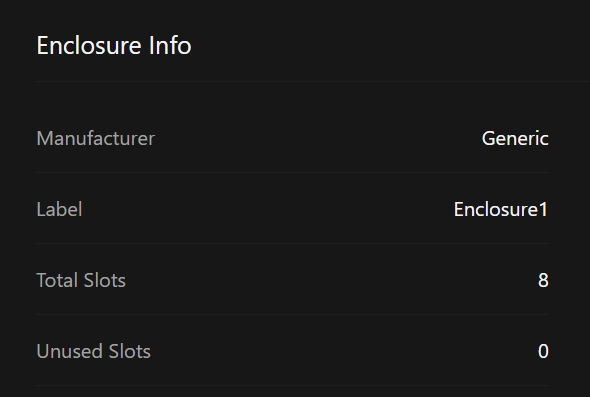
The Enclosure View panel shows detailed enclosure information and controls.
View Mode Controls
The View Mode Controls toggle buttons switch between different enclosure views:
- Healthshows disk health status and diagnostic information.
- Topology shows storage pool and VDEV relationships.
Health Legend
The Health Legend visually relays the status of every disk in the enclosure.
- Online (green) - Disk is online
- Unknown (yellow) - Disk status cannot be determined
- Empty (dashed outline) - No disk installed in slot
Topology Legend
The Topology Legend visually relates drives to the pools they are attached to.
- Pool indicator - A colored dot matching the visual representation for the pool.
- Pool name - The name of the storage pool
Each storage pool is assigned a unique color for easy identification across the enclosure layout.
Enclosure Slots
The Enclosure Slots display a visual grid representation of all disk slots in the enclosure. Each slot displays:
- The current disk name when populated
- A color-coded health status background
- An empty state for available slots
Clicking a slot provides detailed disk information and management options.
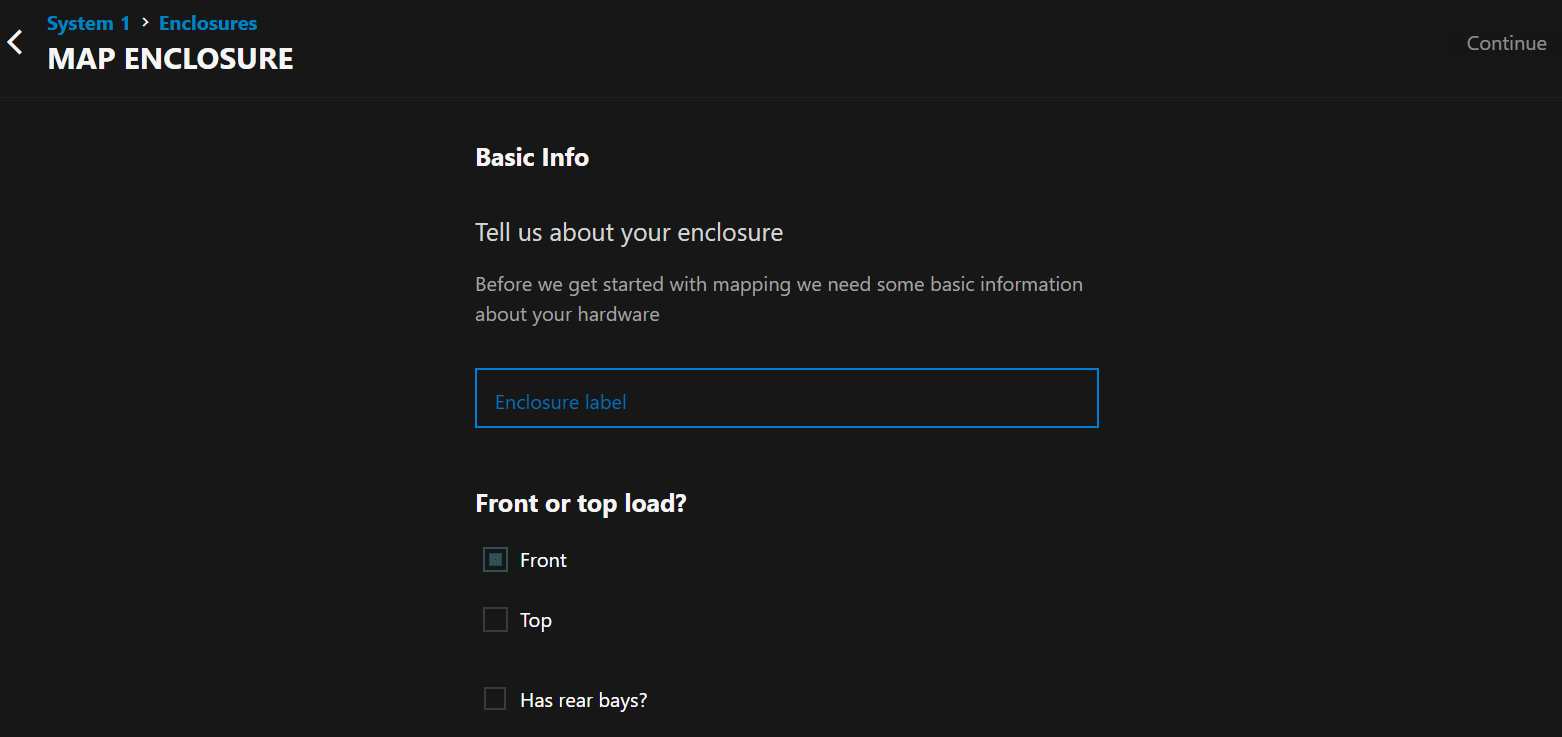
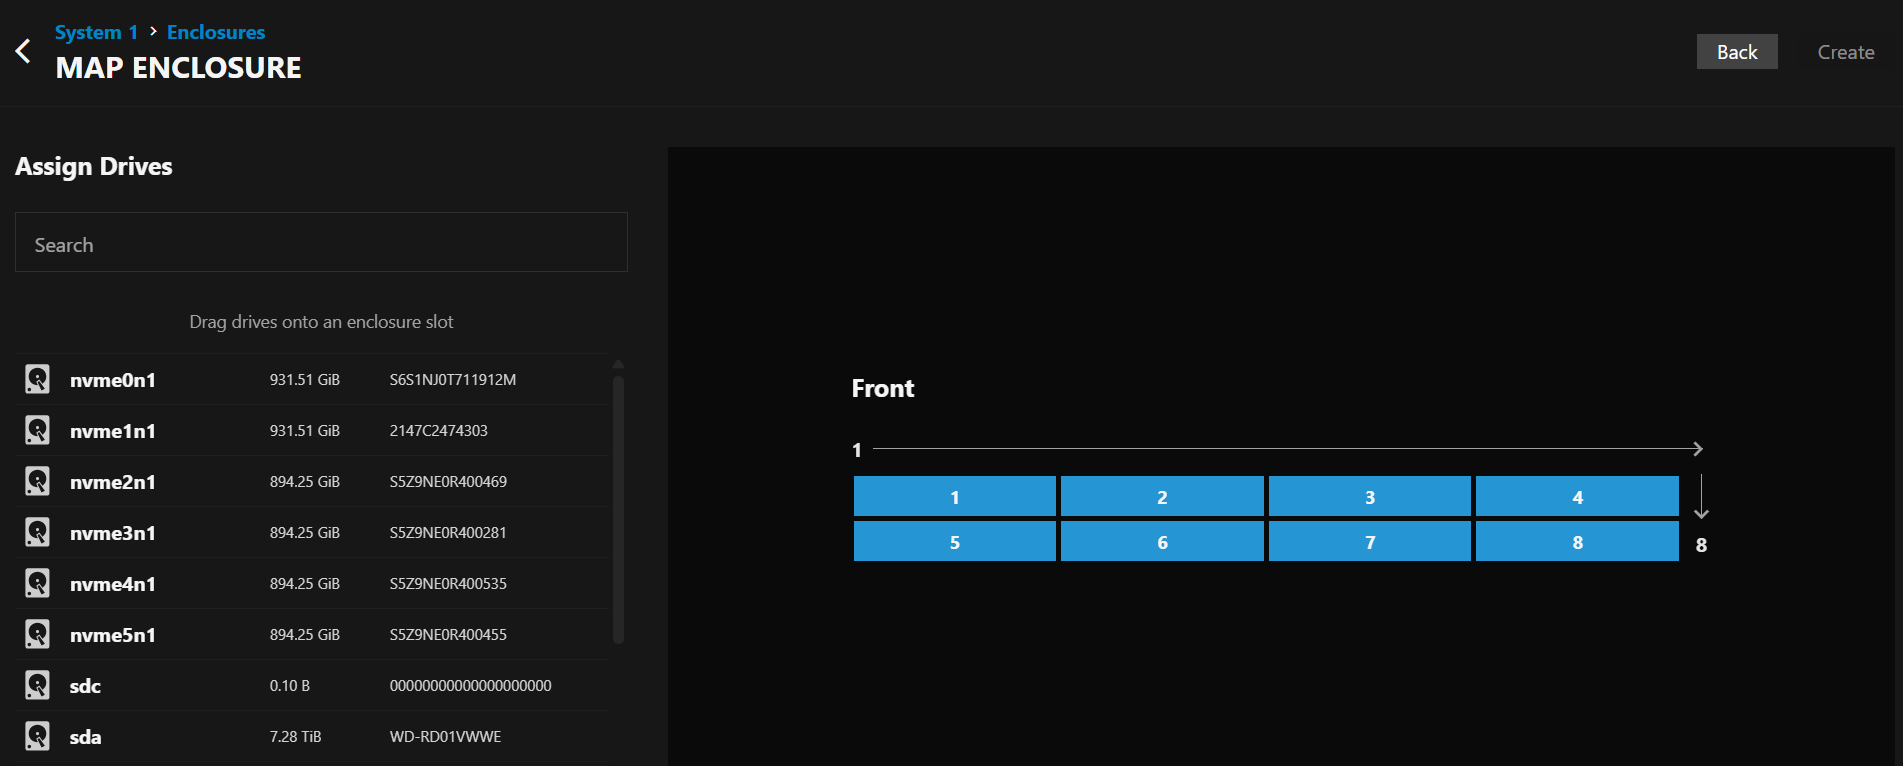
Map Enclosure
The TrueNAS Connect Map Enclosure form lets you configure and map new storage enclosures to your TrueNAS system.
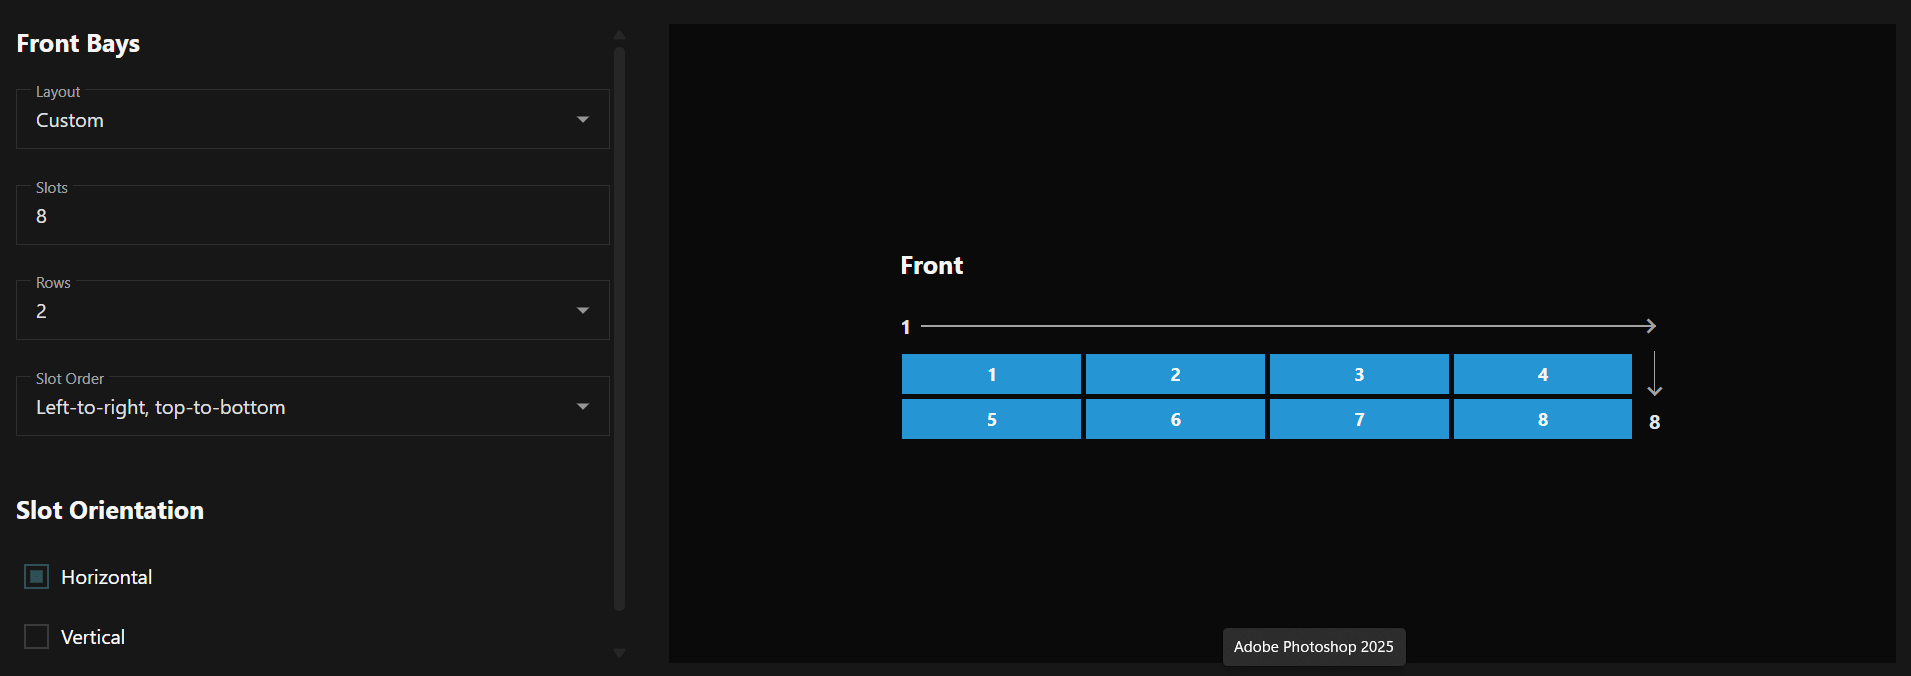
Bay Configuration
The configuration form defines the layout and organization of disk slots.
5 - Historical Data Screen
Historical Data Screen
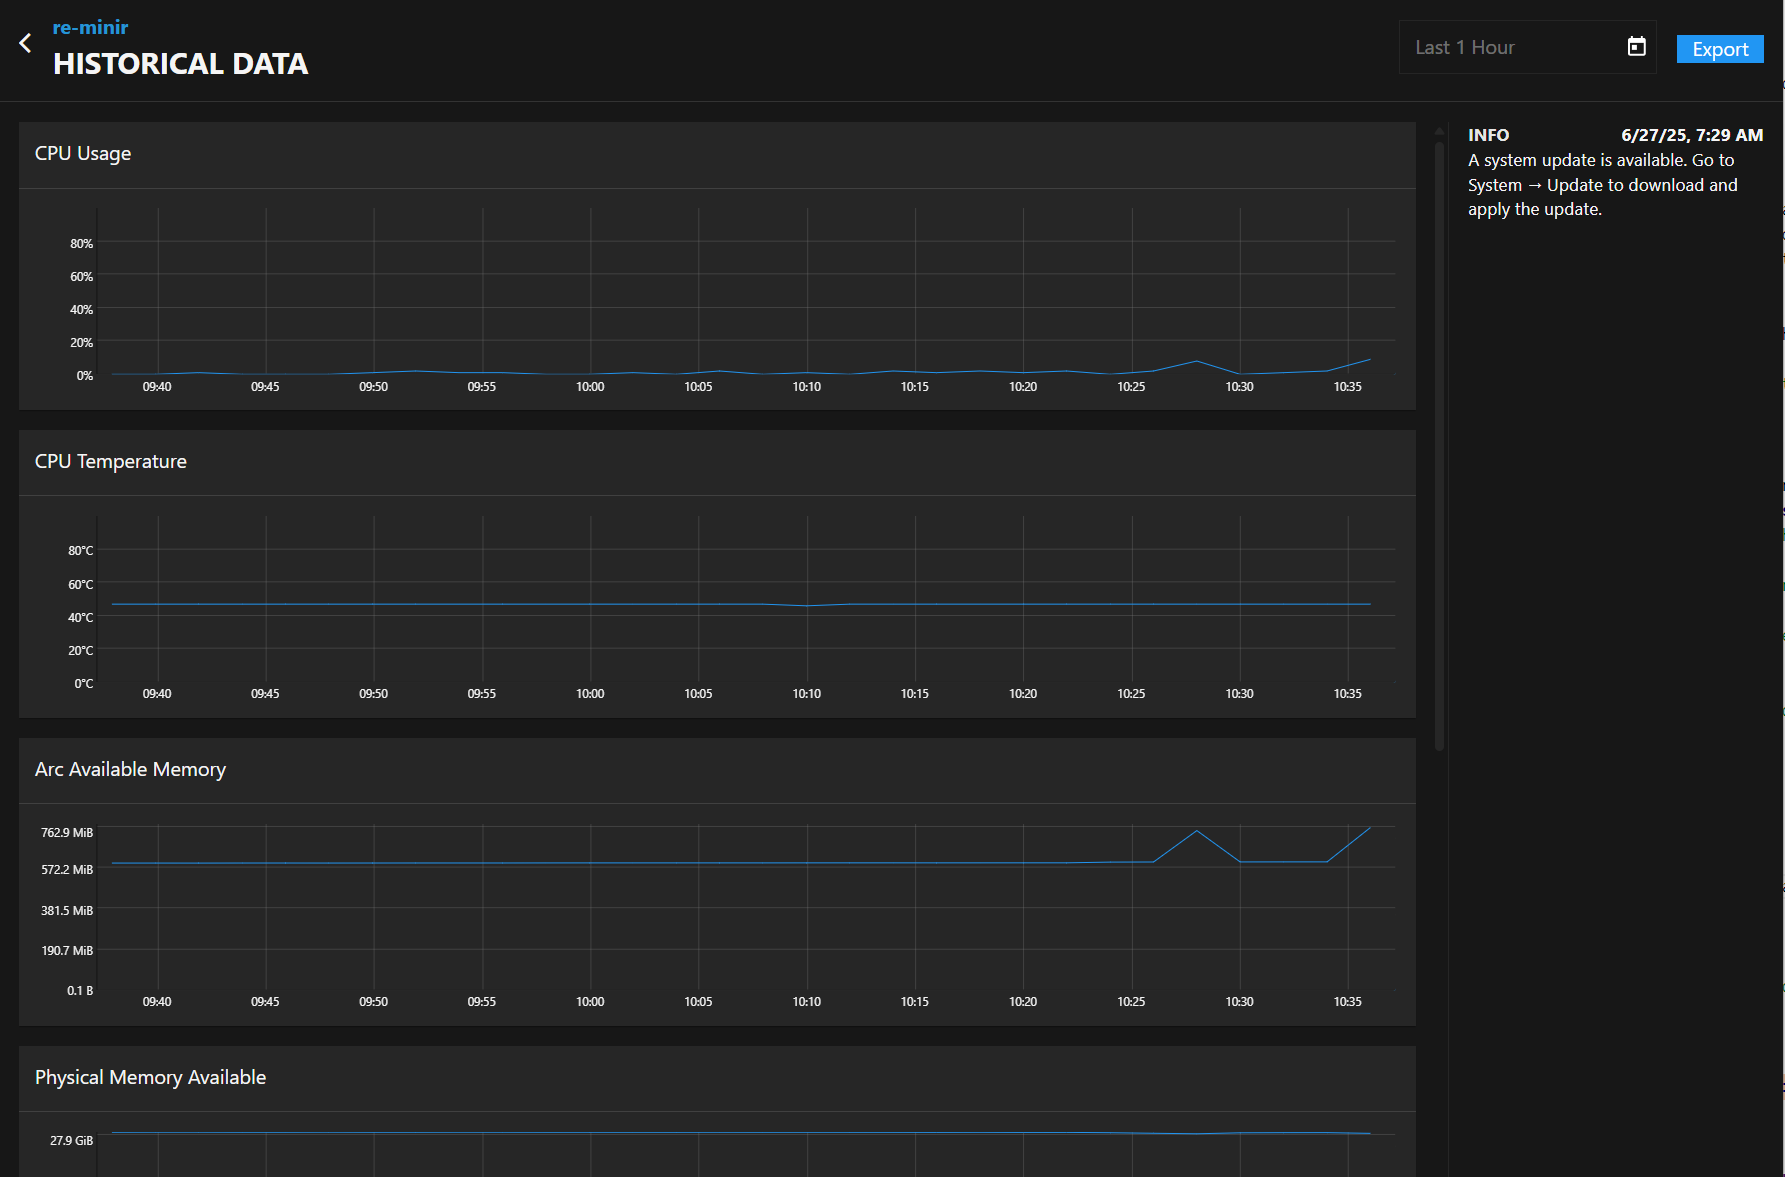
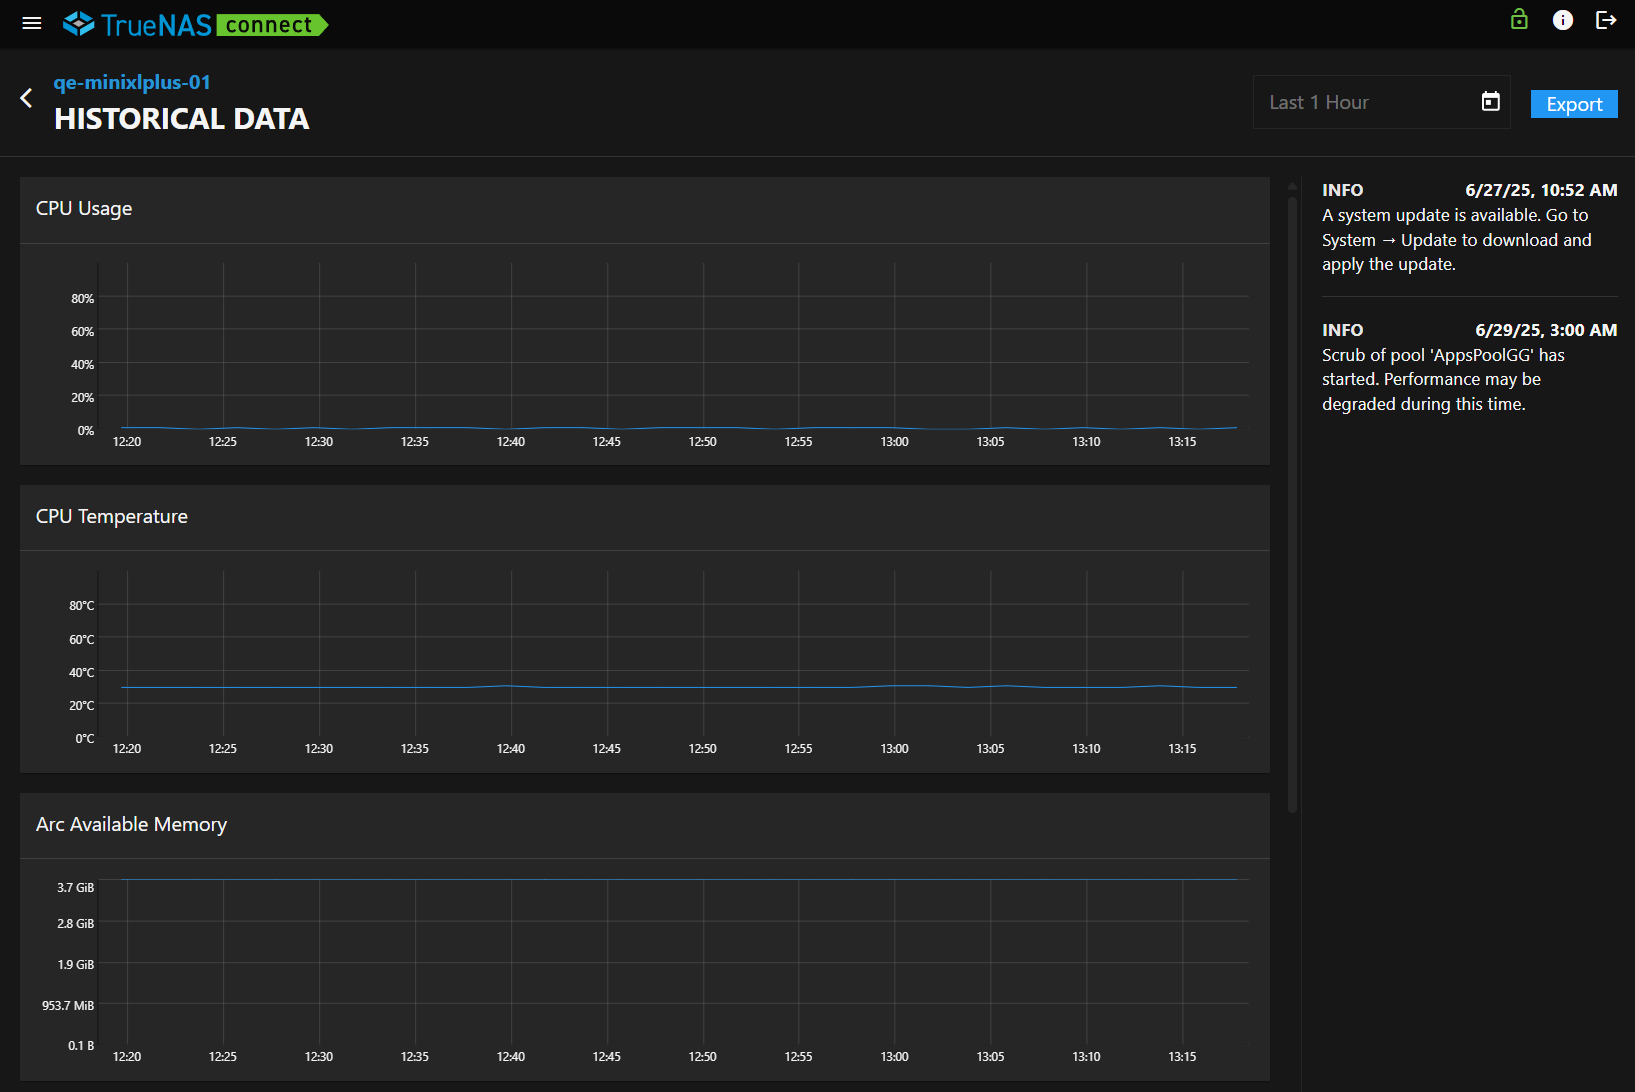
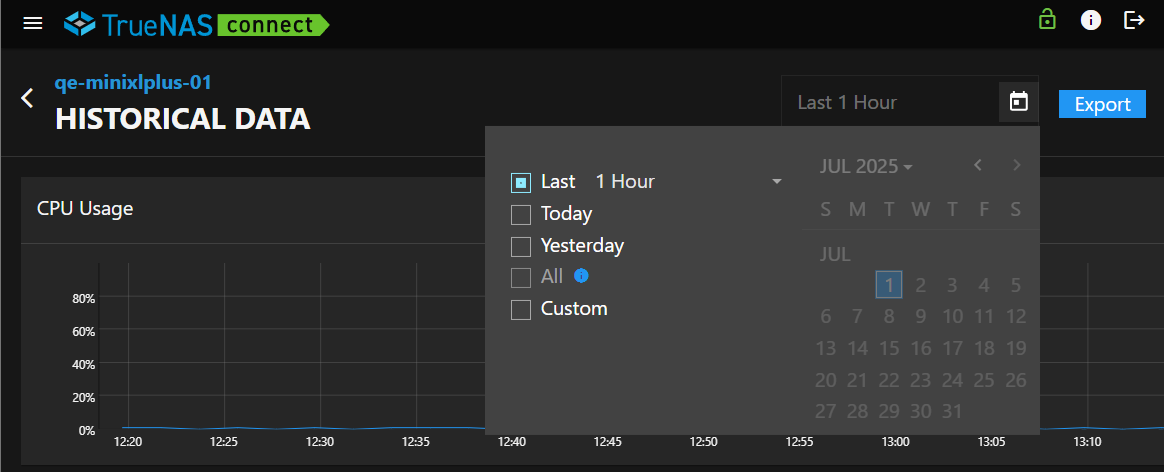
The Historical Data screen shows statistical data graphs of system CPU usage and temperature, memory (ARC, physical, and L2ARC), and demand data. The time period these graphs show changes based on the selection in the data picker dialog.
Filter
The Filter field shows the time period for the data shown in the historical statistical charts. The default is Last 1 Hour. After changing the time option, the time period changes to a specific date or a date range.
Export Button
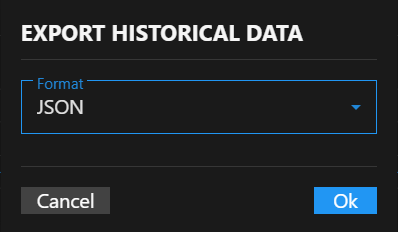
The Export button opens the Export Historical Data dialog.
Export Historical Data
The Export Historical Data dialog exports the statistical data for the selected system in the selected file format.
OK starts the export and closes the dialog. Cancel closes the dialog.
Data Picker Dialog
The data picker dialog opens showing the date options and a calendar.
Date Options
The date options set the time period shown in the historical statistical graphs. Selected option changes the text in the Filter field.
The selectable time period options for statistical data:
- Last 1 Hour - Default time period. The filter field shows this text.
- Today - Shows data for the current calendar date. The filter field shows the current calendar date.
- Yesterday - Shows data for the preceding date. The filter field shows the previous calendar date.
- Custom - Shows data for the date range selected. The filter field shows the date range.
Historical Statistics Graphs
The Historical Data screen shows historical statistical graphs in six categories:
- CPU Usage
- CPU Temperature
- ARC Available Memory
- Physical Memory Available
- L2ARC Access Hit Percentage
- Demand Data Hit Percentage
Data shown in these statistical graphs varies based on the selected option in the Data Picker dialog.
6 - Inventory Screen
The TrueNAS Connect Inventory screen provides comprehensive hardware and storage information for all connected TrueNAS systems in your fleet.
Header Controls
The header section contains navigation and export functionality for the inventory data.
Systems Inventory
The main content area displays system identification and hardware information cards for all connected TrueNAS systems.
TrueNAS Connect identifies each system in the inventory by host name.
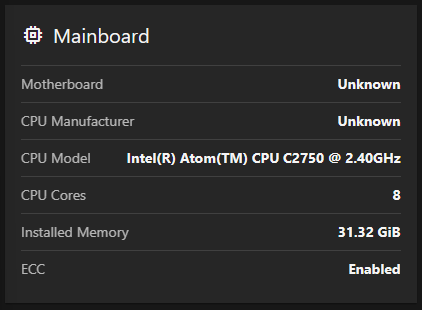
Mainboard Widget
Mainboard displays hardware specifications for the system motherboard and processor components.
Motherboard
Displays the motherboard model and manufacturer information. Displays Unknown when motherboard details cannot be detected.
CPU Manufacturer
Shows the processor manufacturer (Intel, AMD, etc.). Displays Unknown when manufacturer information is not available.
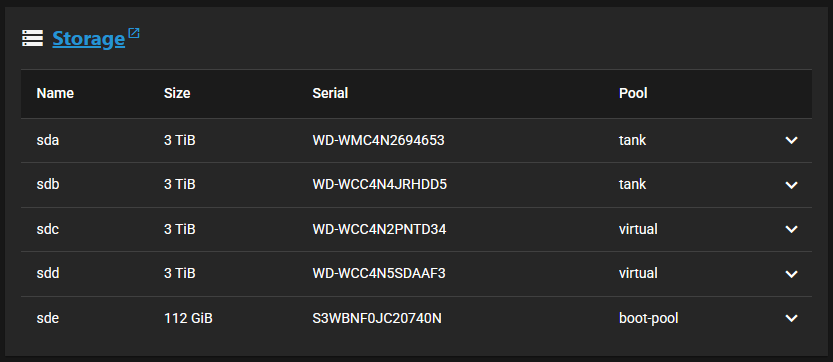
Storage Widget
Displays detailed information about storage devices and their configuration.
The Storage widget title links to the TrueNAS Storage Dashboard screen for the selected system.
Storage Device Table
Expandable table component displaying all storage devices in the system with the following columns:
- Name: Device identifier (sda, sdb, etc.)
- Size: Storage capacity in TiB or GiB
- Serial: Device serial number for identification
- Pool: ZFS pool assignment for the device
Expand Row Button
The button in each table row expands the row to show detailed device information containing comprehensive disk specifications. The expanded row displays information including disk type, model, transfer mode, rotation rate, HDD standby settings, and advanced power management configuration.
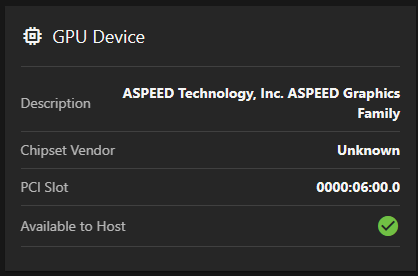
GPU Device Widget
Displays graphics processing unit specifications and availability status.
Description
Complete graphics device description including manufacturer and product family. Example: ASPEED Technology, Inc. ASPEED Graphics Family.
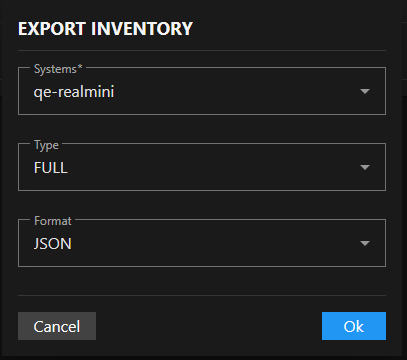
Export Inventory Dialog
The Export button opens the Export Inventory dialog with export options to download inventory information in various formats.
Systems Selection
Multi-select dropdown to choose which TrueNAS systems to include in the inventory export. Displays connected systems by host name (e.g., my-system). Multiple systems can be selected for batch export.
Type Selection
Dropdown to select the scope of inventory data to export:
- Full: Complete comprehensive inventory including system info, detailed hardware specifications, disk information with ZFS pool assignments, GPU details, and technical attributes like physical memory, CPU cores, load averages, and SMART data
- Systems: High-level system information only including system ID, hostname, serial number, TrueNAS version, CPU model, core count, and total memory - ideal for system inventory and asset tracking
- Disks: Storage-focused export containing disk names, models, serial numbers, capacity, type (HDD/SSD), rotation rates, and system association - useful for storage planning and disk management
Format Selection
Dropdown to choose the file format for the exported inventory data:
- JSON: Structured data format suitable for programmatic processing and API integration
- CSV: Comma-separated values format for spreadsheet applications and data analysis
Cancel closes the dialog without performing an export.
Ok executes the inventory export with selected parameters and downloads the resulting file.
7 - Keyring Screen
The TrueNAS Connect Keyring screen displays TrueNAS systems and their encrypted key storage status, and allows users to reset the keyring.
Keyring Table
The keyring table displays all TrueNAS systems with stored encrypted keys containing the following columns:
TrueNAS Column
The TrueNAS column displays the host name or identifier of connected TrueNAS systems. The system name shows as it appears in TrueNAS Connect (e.g., my-system).
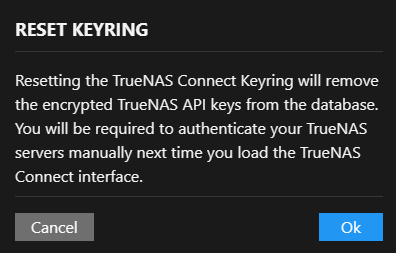
Reset Keyring Dialog
The Reset Keyring dialog shows a reset warning about keyring reset consequences.
Resetting the keyring permanently removes encryption keys from the database, and users must manually authenticate each TrueNAS server after reset.
Ok proceeds with keyring reset and removes all encrypted keys from the database. Cancel closes the reset dialog without resetting the key and returns to the Keyring screen.
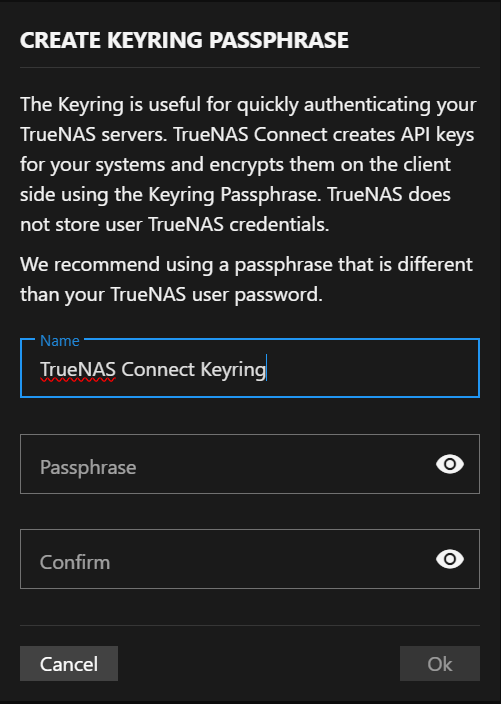
Create Keyring Passphrase Dialog
The Create Keyring button opens the Create Keyring Passphrase dialog for setting up encrypted API key storage.
The dialog explains that the keyring provides quick authentication for TrueNAS servers by creating and encrypting API keys client-side using a passphrase.
The dialog recommends using a passphrase different from your TrueNAS user password and suggests strong passphrases should be at least 16 characters long with a mix of uppercase letters, lowercase letters, numbers, and special characters.
Unlock Keyring Dialog
The Unlock Keyring dialog shows when you sign into TrueNAS Connect if you created a keyring to authenticate your registered (added) system.
Passphrase
Passphrase entered unlocks a system added to or covered by the keyring. Adding a keyring creates an API key between the TrueNAS server and TrueNAS Connect. To view the API key, log into the TrueNAS server as an administrator and go to the User API Key screen.
OK submits the passphrase to the system for authentication. A correctly entered passphrase unlocks all systems associated with the authentication keyring. Cancel closes the dialog without submitting the passphrase.
8 - Notification Tasks Screen
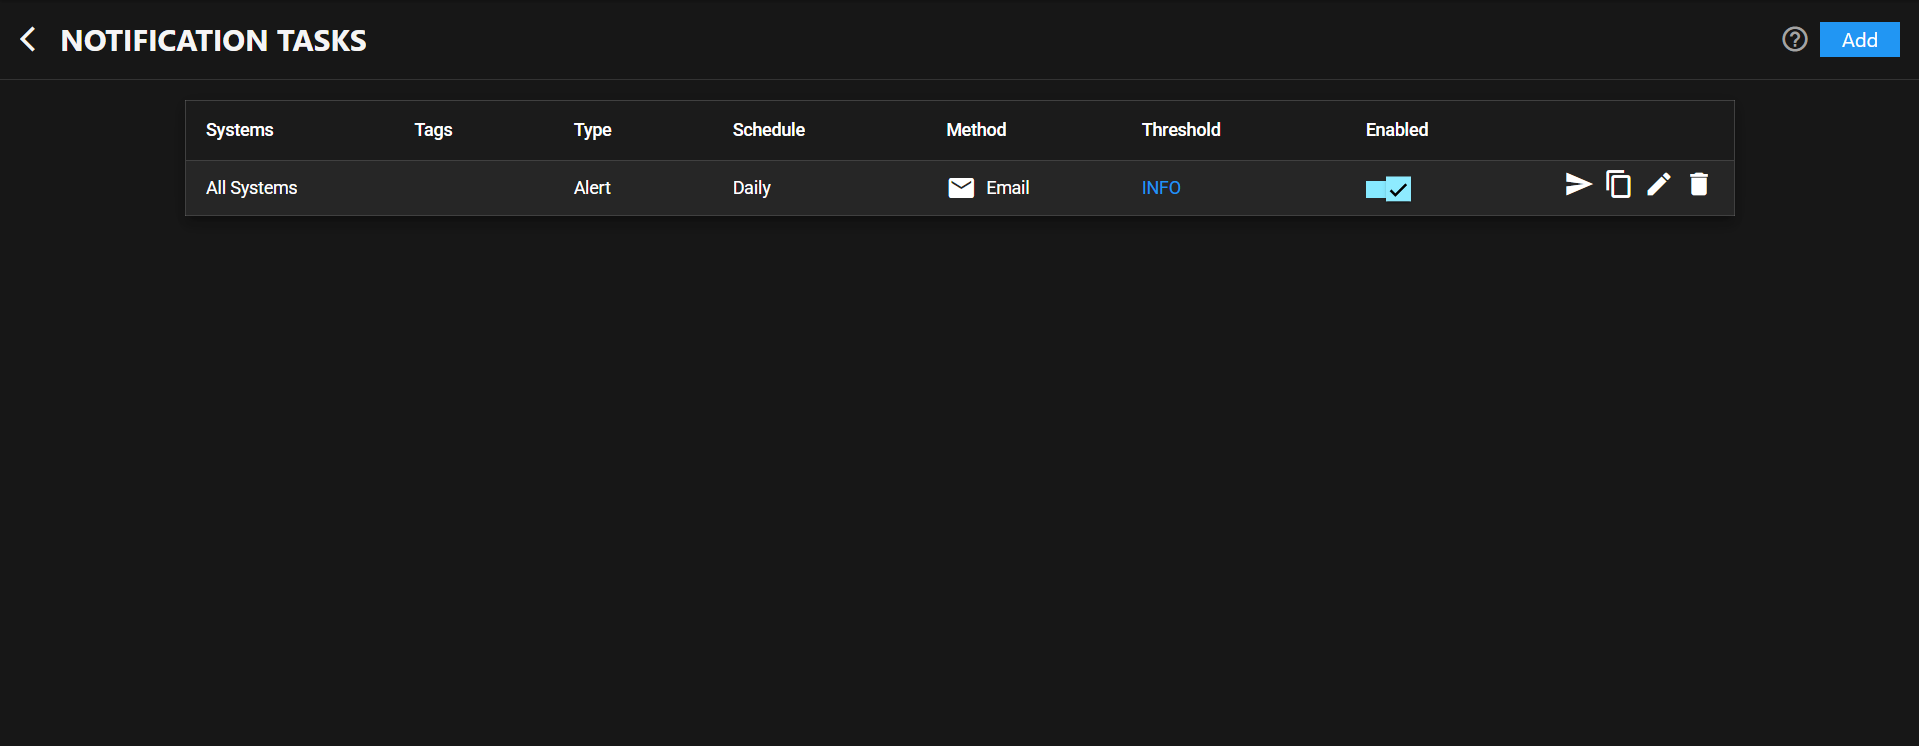
The TrueNAS Connect Notification Tasks screen provides centralized configuration and management of automated notification tasks that monitor connected TrueNAS systems and send alerts based on specified criteria.
Header Controls
The header section contains navigation, help access, and task creation functionality.
Notification Tasks Table
The main content displays notification tasks in a sortable table with configuration details and management actions.
Tasks Table
Sortable table component displaying all configured notification tasks with the following columns:
- Systems: Target TrueNAS system names (examplesystem)
- Tags: Associated system tags for grouping notifications
- Type: Notification type (Alert, Report)
- Schedule: Notification frequency (Hourly, Immediately)
- Method: Notification delivery method with icon (Email )
- Threshold: Alert severity level with color coding (INFO, CRITICAL)
- Enabled: Toggle switch showing task activation status
Each column header includes sort functionality with arrow indicators.
Enabled Toggle
Enabled slide toggle controls whether the notification task actively monitors and sends alerts. Toggle shows checkmark when enabled, dash when disabled.
Task Actions
Action buttons provide task management functionality:
- Test sends a test notification using the configured method
- Duplicate creates a copy of the task with the same settings
- Edit opens the Edit Notification Task panel
- Delete removes the notification task permanently
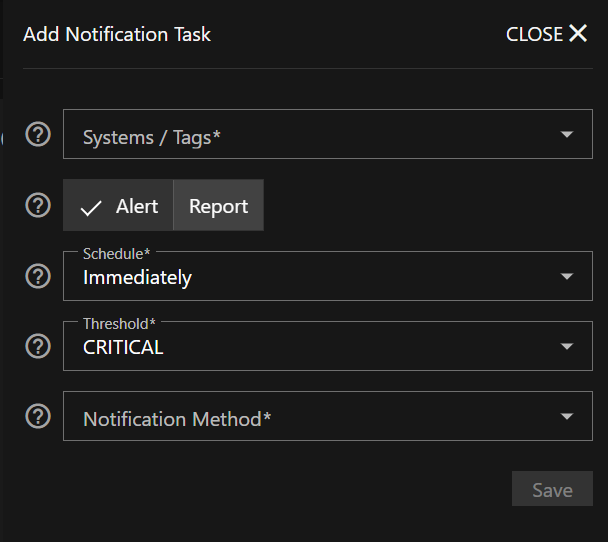
Add Notification Task Panel
The Add Notification Task panel provides form fields for creating new notification tasks.
Systems / Tags Field
Systems / Tags multi-select dropdown specifies target systems or system groups for monitoring. This is a required field with validation indicators.
Notification Type Field
Notification Type radio button selection determines the notification behavior:
- Alert: Sends notifications when alert conditions are triggered based on threshold settings
- Report: Sends automated reports containing system performance data, storage usage trends, alert summaries, and predictive analysis
Schedule Field
Schedule Set notification frequency based on type:
Alert notifications:
- Immediately: Send notifications as events occur
- Hourly, Daily, Weekly, Monthly: Aggregate and send notifications at specified intervals
Report notifications:
- Hourly, Daily, Weekly: Schedule automated report delivery
Threshold Field
Threshold dropdown sets minimum alert severity level:
For Alert notifications:
- Critical: Only critical system issues
- Error: Error-level alerts and above
- Warning: Warning-level alerts and above
- Info: All informational messages and above
For Report notifications: Determines the minimum alert level to include in alert history summaries within automated reports.
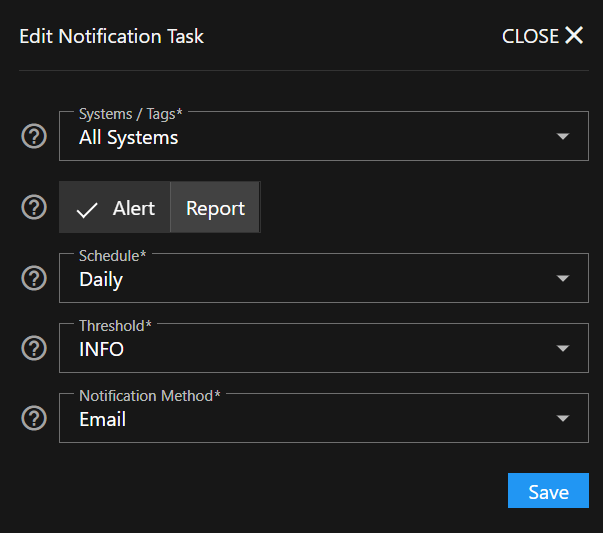
Edit Notification Task Panel
The Edit Notification Task panel allows modification of existing notification task settings.
Edit Form
Same form component as Add Notification Task panel, pre-populated with current task settings.
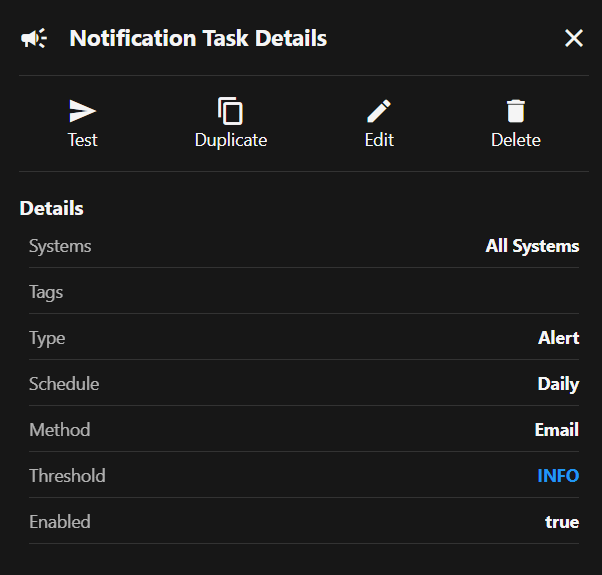
Notification Task Details Panel
The Notification Task Details panel displays comprehensive information and management controls for selected tasks.
Detail Actions
Action buttons provide task management functionality and are available on the right side of each entry in the Notification Tasks table:
- Test sends a test notification using the task configuration
- Duplicate creates a copy of the task
- Edit opens the edit panel for the task
- Delete permanently removes the notification task
Details Section
Details displays complete task configuration:
- Systems: Target system names (examplesystem)
- Tags: Associated system tags (empty if none)
- Type: Notification type (Alert or Report)
- Schedule: Notification timing (Hourly)
- Method: Delivery mechanism (Email)
- Threshold: Alert severity level with color coding (INFO)
- Enabled: Activation status (true)
9 - Profile Screen
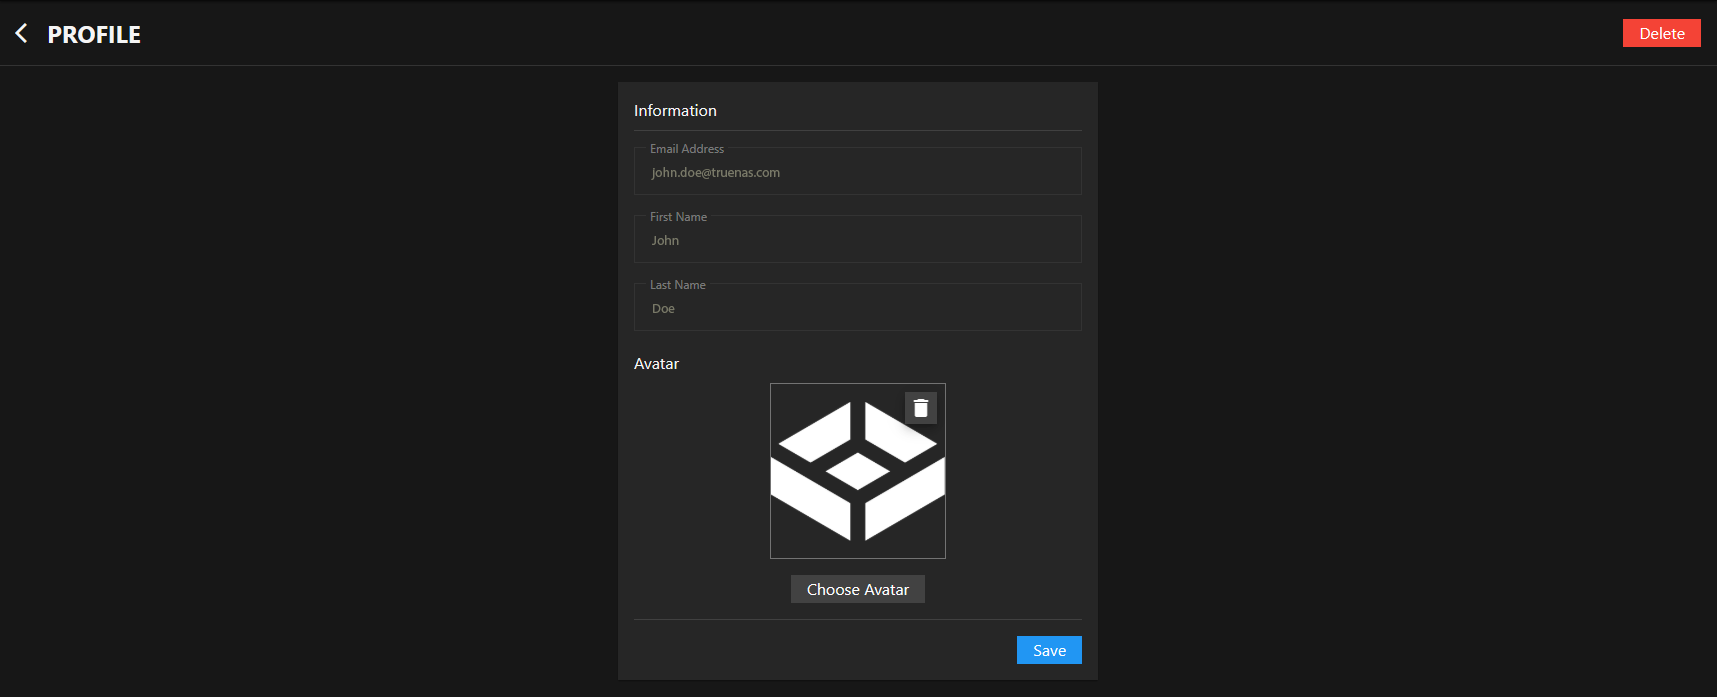
The TrueNAS Connect Profile screen provides user information, avatar settings, and account deletion options.
Profile Information
The main content area displays user account information and avatar management options.
Information Form
The Information section displays user account details in form fields.
Email Address
Displays the user’s email address associated with the TrueNAS Connect account. The field is disabled and shows the email used for account authentication.
Avatar
The Avatar section manages the user profile image.
The image area displays the current avatar image or a default person icon when no avatar is set.
Choose Avatar opens a file selection dialog to upload a new profile image.
The uploader accepts image files in JPG, PNG, and WebP formats.
The button deletes the current avatar and restores the default image.
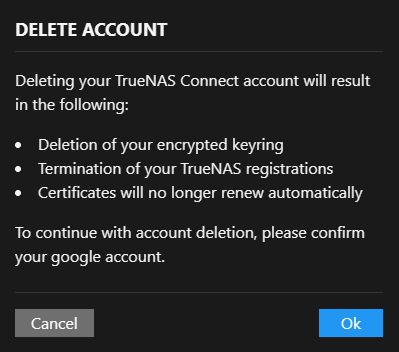
Delete Account Dialog
The Delete button opens a confirmation dialog explaining the consequences of account deletion.
The confirmation dialog displays warnings about permanent account deletion consequences. Deleting your TrueNAS Connect account results in:
- Deletion of your encrypted keyring: All stored encryption keys are permanently removed
- Termination of your TrueNAS registrations: Systems are no longer registered with TrueNAS Connect
- Certificates will no longer renew automatically: SSL/TLS certificates require manual renewal
10 - Tags Screen
11 - Top Toolbar
Top Toolbar
The top toolbar shows at the top of all TrueNAS Connect screens.
It provides access to the main navigation menu and three buttons:
About Dialog
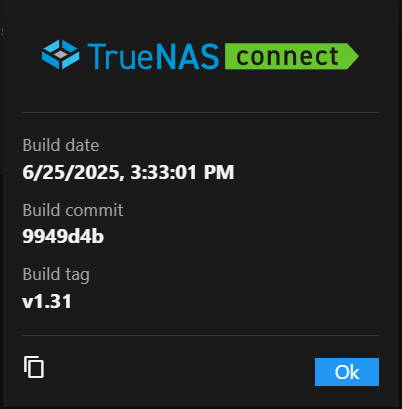
The TrueNAS Connect (About) dialog shows the build date, build commit, and build tag for the service.
Build date shows the calendar month, day, year, and time of the current build of the service.
Build commit shows the commit hash assigned to the current build in GitHub.
Build tag shows the current version of the service.
The content_copy (copy to clipboard) icon copies all the build information to the clipboard and shows a message at the top of the screen confirming the action occurred.
Download Logs downloads the TrueNAS Connect logs for troubleshooting purposes.
Ok closes the dialog.


