Historical Data Screen
2 minute read
Historical Data Screen
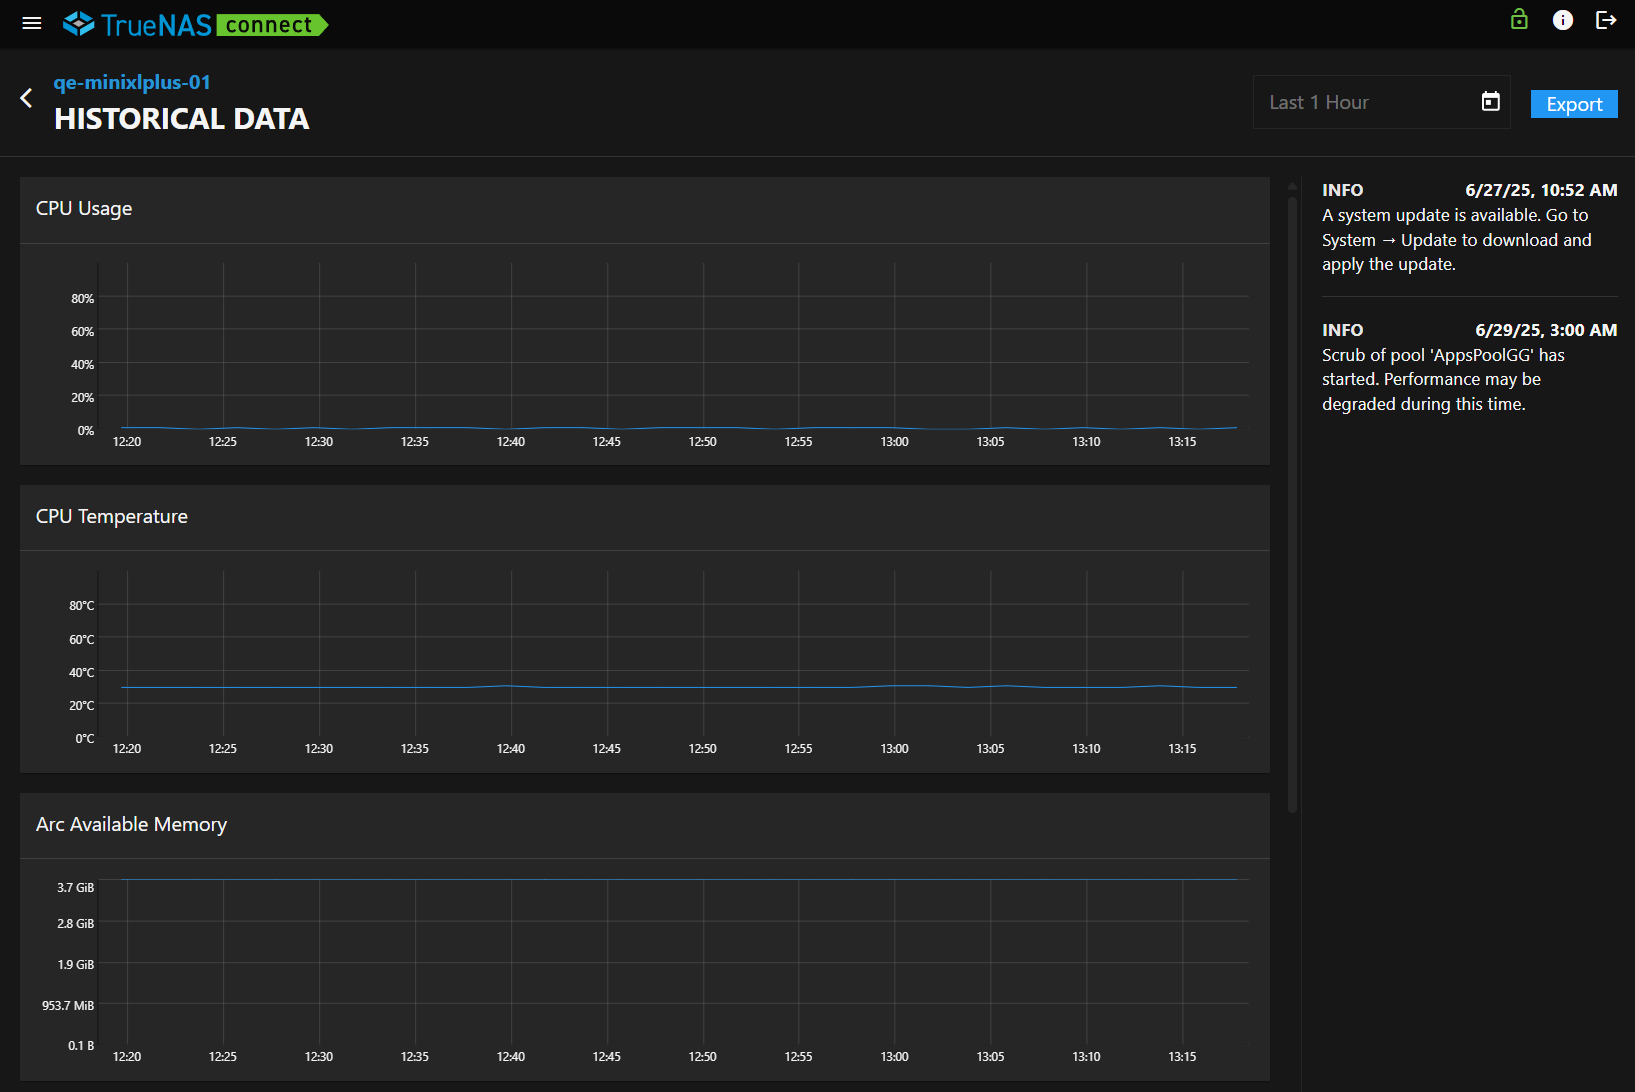
The Historical Data screen shows statistical data graphs of system CPU usage and temperature, memory (ARC, physical, and L2ARC), and demand data. The time period these graphs show changes based on the selection in the data picker dialog.
Filter
The Filter field shows the time period for the data shown in the historical statistical charts. The default is Last 1 Hour. After changing the time option, the time period changes to a specific date or a date range.
Export Button
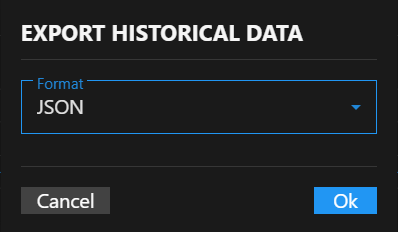
The Export button opens the Export Historical Data dialog.
Export Historical Data
The Export Historical Data dialog exports the statistical data for the selected system in the selected file format.
OK starts the export and closes the dialog. Cancel closes the dialog.
Data Picker Dialog
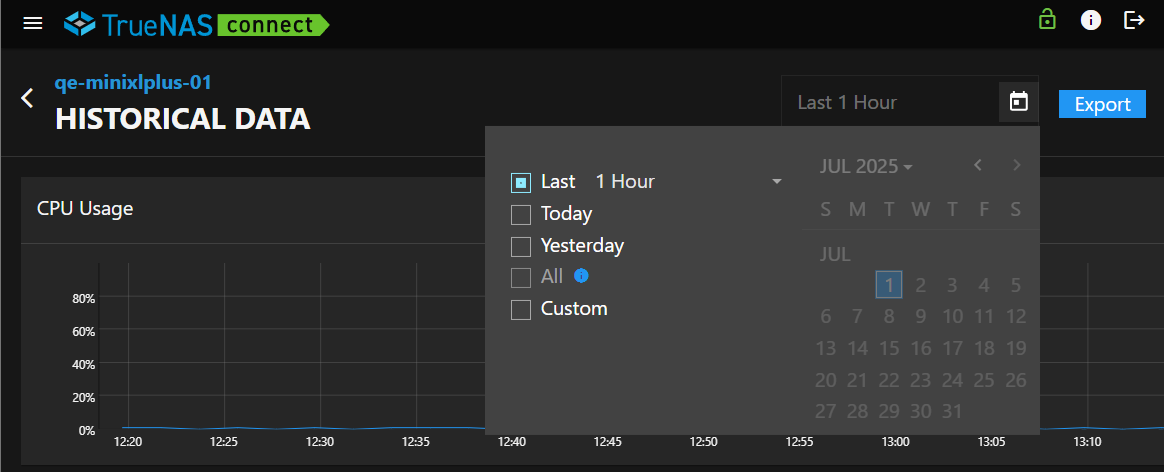
The data picker dialog opens showing the date options and a calendar.
Date Options
The date options set the time period shown in the historical statistical graphs. Selected option changes the text in the Filter field.
The selectable time period options for statistical data:
- Last 1 Hour - Default time period. The filter field shows this text.
- Today - Shows data for the current calendar date. The filter field shows the current calendar date.
- Yesterday - Shows data for the preceding date. The filter field shows the previous calendar date.
- Custom - Shows data for the date range selected. The filter field shows the date range.
Historical Statistics Graphs
The Historical Data screen shows historical statistical graphs in six categories:
- CPU Usage
- CPU Temperature
- ARC Available Memory
- Physical Memory Available
- L2ARC Access Hit Percentage
- Demand Data Hit Percentage
Data shown in these statistical graphs varies based on the selected option in the Data Picker dialog.


