Dashboard Screen
9 minute read
Dashboard Screen
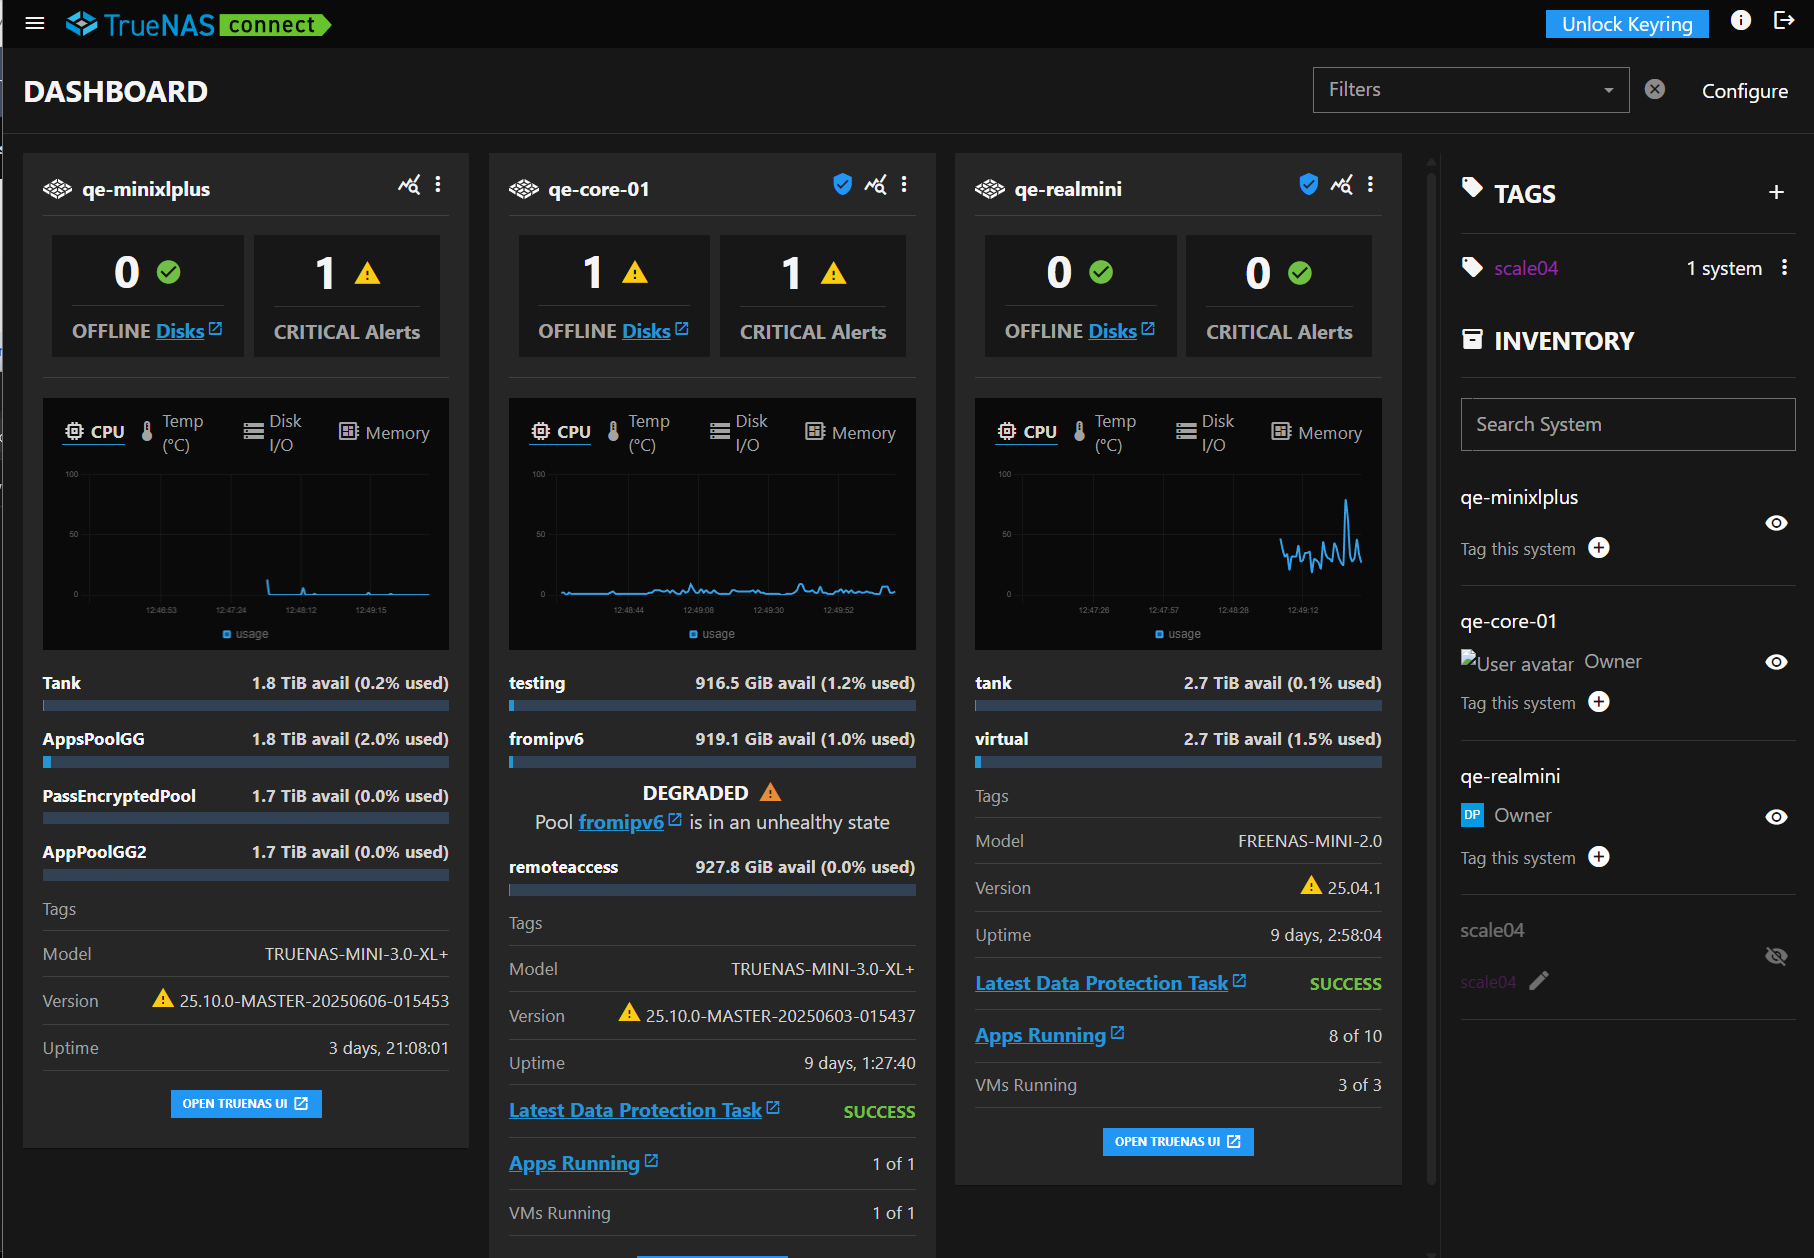
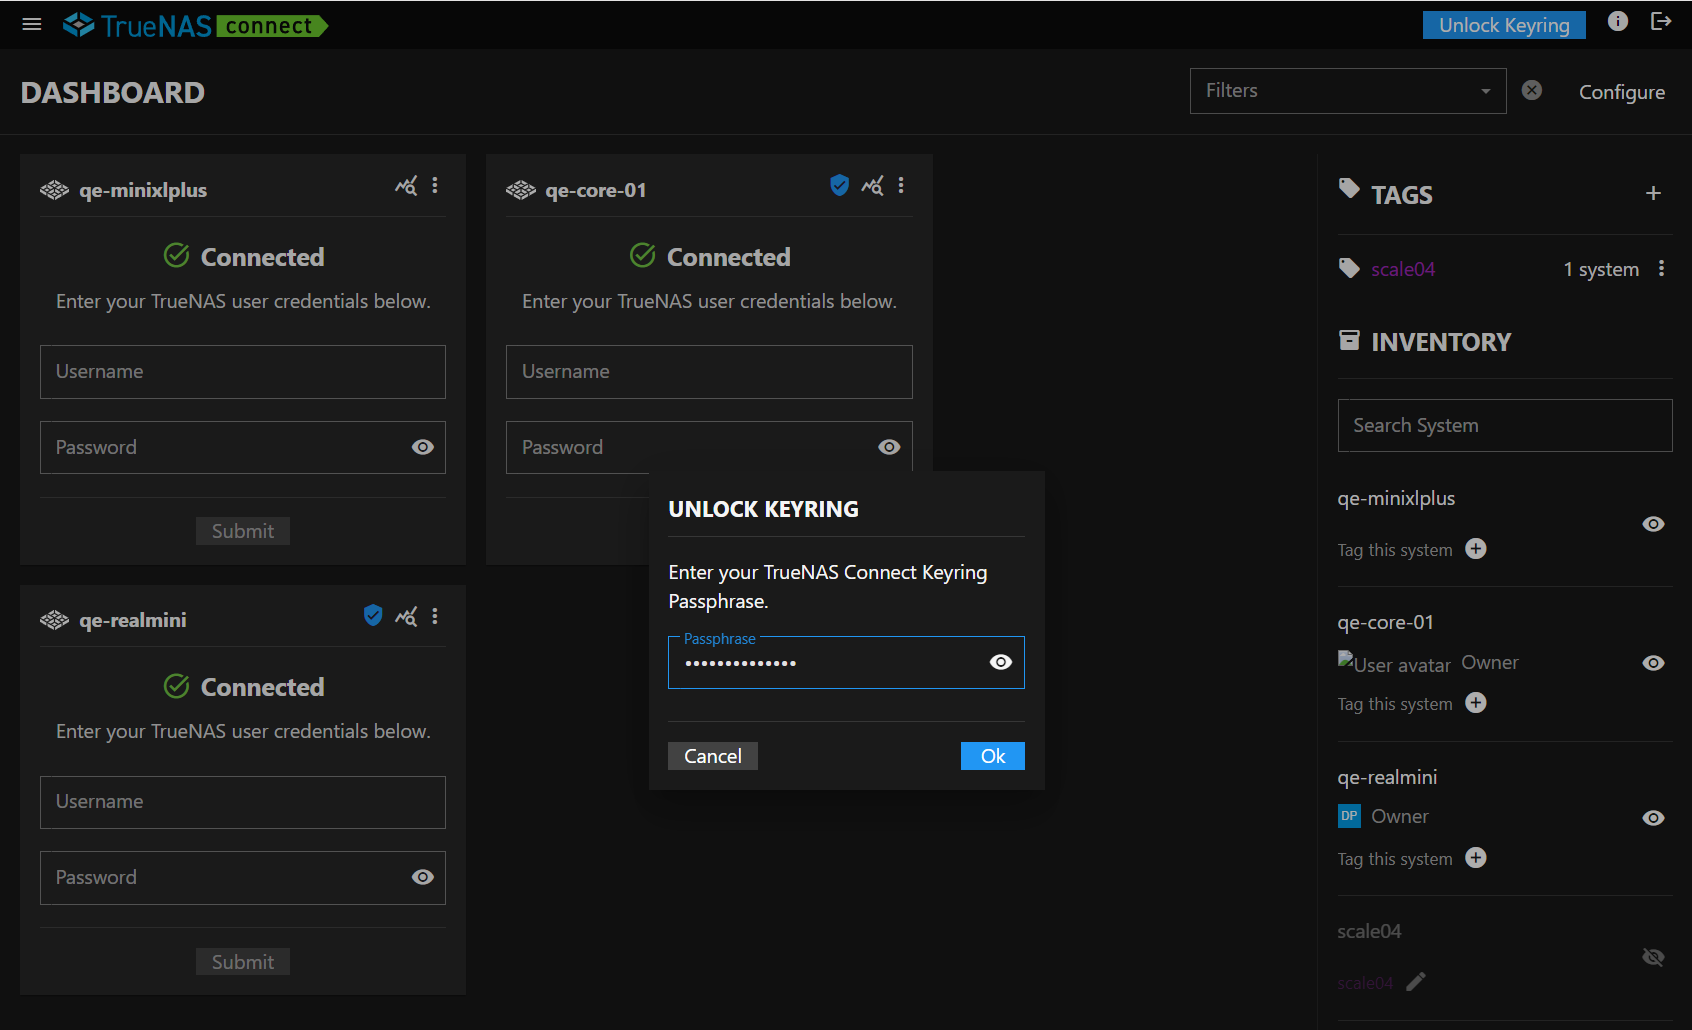
The Dashboard screen shows authentication dialogs and system cards after logging into TrueNAS Connect. After authenticating registered systems, it shows system cards populated with information on and for each system, and a side panel showing Tags and Inventory quick-access lists.
The Dashboard header shows a Filter field and Configure button.
Authentication Dialogs
After signing into TrueNAS Connect, the main Dashboard shows one or more authentication methods:
- Unlock Keyring dialog if a keyring passphrase is added
- System cards with TrueNAS system authentication credentials
After entering the keyring passphrase or TrueNAS system administration credentials, the system information cards show on the Dashboard.
The Add to Keyring option on an unauthenticated system card adds the system to the keyring authentication.
Unlock Keyring Dialog
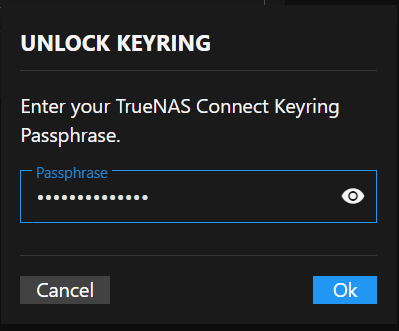
The Unlock Keyring dialog shows when you sign into TrueNAS Connect if you created a keyring to authenticate your registered (added) system.
Passphrase
Passphrase entered unlocks a system added to or covered by the keyring. Adding a keyring creates an API key between the TrueNAS server and TrueNAS Connect. To view the API key, log into the TrueNAS server as an administrator and go to the User API Key screen.
OK submits the passphrase to the system for authentication. A correctly entered passphrase unlocks all systems associated with the authentication keyring. Cancel closes the dialog without submitting the passphrase.
Dashboard Configuration dialog
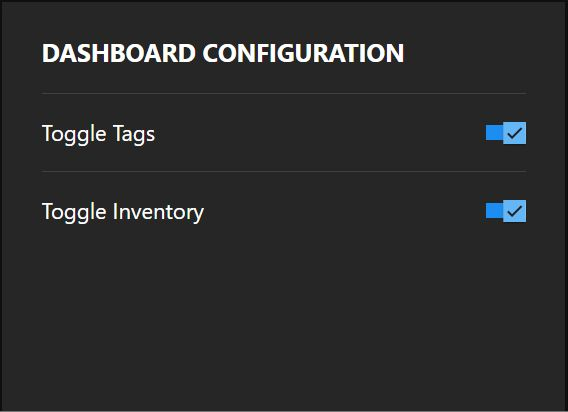
The Dashboard Configuration dialog shows two options that determine whether Tags and/or Inventory show in the right side panel of the Dashboard screen.
Add System Dialog
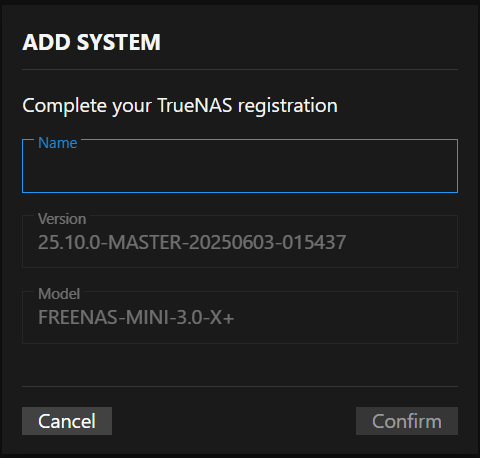
The Add System dialog shows on the Dashboard the first time you sign into TrueNAS Connect from a TrueNAS system, and prompts you to complete the system registration.
Version shows the TrueNAS release. Model shows the TrueNAS system model number.
Name
Name specifies a name for the TrueNAS system you register in TrueNAS Connect. Names can include upper and lowercase letters, numbers, and the dash (-) or underscore (_) special characters. Choose a name that helps you remember the TrueNAS system. For example, the host name assigned to the system, the system function (i.e.,backup1), or location of the system (i.e., tn-tnas1).
Confirm adds and registers the TrueNAS system as the name entered. Cancel closes the Add System dialog without adding or registering the TrueNAS system.
Filter
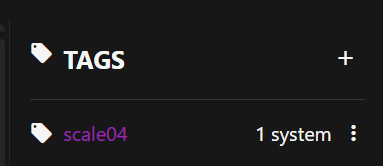
The Filters field at the top of the Dashboard screen shows a dropdown list of filter options. The options narrow a search of systems to those matching the selected options. Filter options are: Online, Offline, Critical Alerts, Updates, and tag names (labels) added to systems in the service.
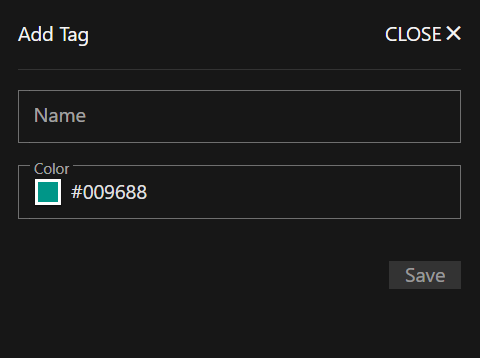
Add Tag
Use the Add Tag form to create a tag (label) in TrueNAS Connect that you can apply to systems. Applying tags to systems labels the systems according to the function, location, or any other useful information you want to use when searching for a system in TrueNAS Connect.
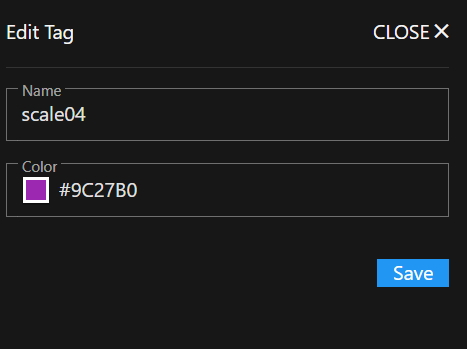
Edit Tag
Use the Edit Tag form to change the name or color assigned to a tag (label).
Edit Tag on the menu icon to the right of each tag item opens the Edit Tag form.
Delete Confirmation
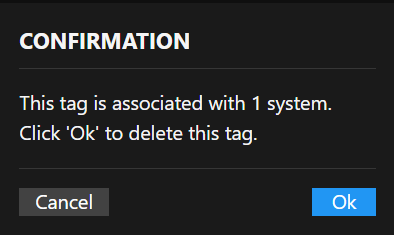
The Confirmation dialog prompts you to verify that you want to delete the selected tag.
Delete on the menu icon to the right of each tag item listed on the Tags screen or in the Tags area in the Dashboard side panel opens the Confirmation dialog.
Ok deletes the tag. Cancel closes the dialog without deleting the tag.
Inventory
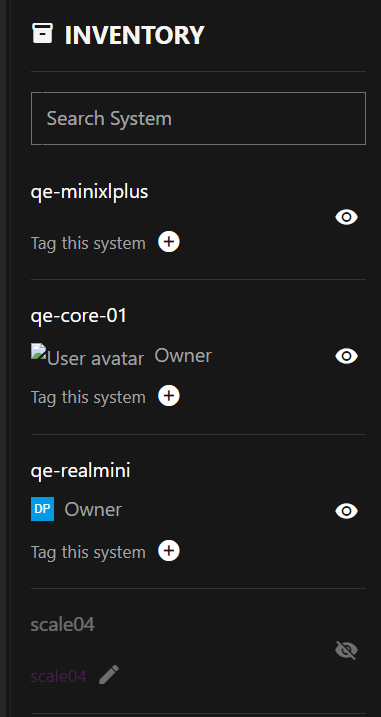
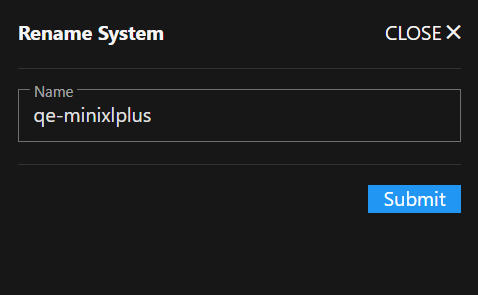
Inventory, in the Dashboard right side panel, shows individual system items for systems in TrueNAS Connect.
The add tag icon shows a list of tags added to the system that you can select and assign to the system.
The icon toggles to and back when clicked. It grays out the system item after clicking the icon, and activates it after clicking .
System Cards
System cards show information on disk status, number of critical alerts on the system, a graph with four views (CPU, Temp, Disk I/O, and Memory), information on available storage in system pools, tags applied to the system, the system model number, TrueNAS version on the system, system uptime, and links that open the TrueNAS system screens for data protection tasks, apps, and any VMs running on the system.
Open TrueNAS UI
The Open TrueNAS UI button opens the TrueNAS system main Dashboard screen. Links to the TrueNAS UI open in a new browser tab.
Disk Status
Disk Status shows the health status of system disks, and the Offline Disks links to the TrueNAS UI Disks screen in the TrueNAS UI.
Critical Alerts
Critical Alerts shows the number of critical alerts. When clicked, it opens an alert pane showing the date and time of the critical alert(s).
Realtime Graphs
Realtime Graphs shows four selectable bar graphs.
The default graph is CPU. Each title in the graph shows that graph. The graphs panel includes four graphs:
- CPU - Shows CPU usage over time.
- Temp - Shows the hottest core reading over time.
- Disk I/O - Shows read_bytes and write_bytes in Kilobytes.
- Memory - Shows memory usage over time.
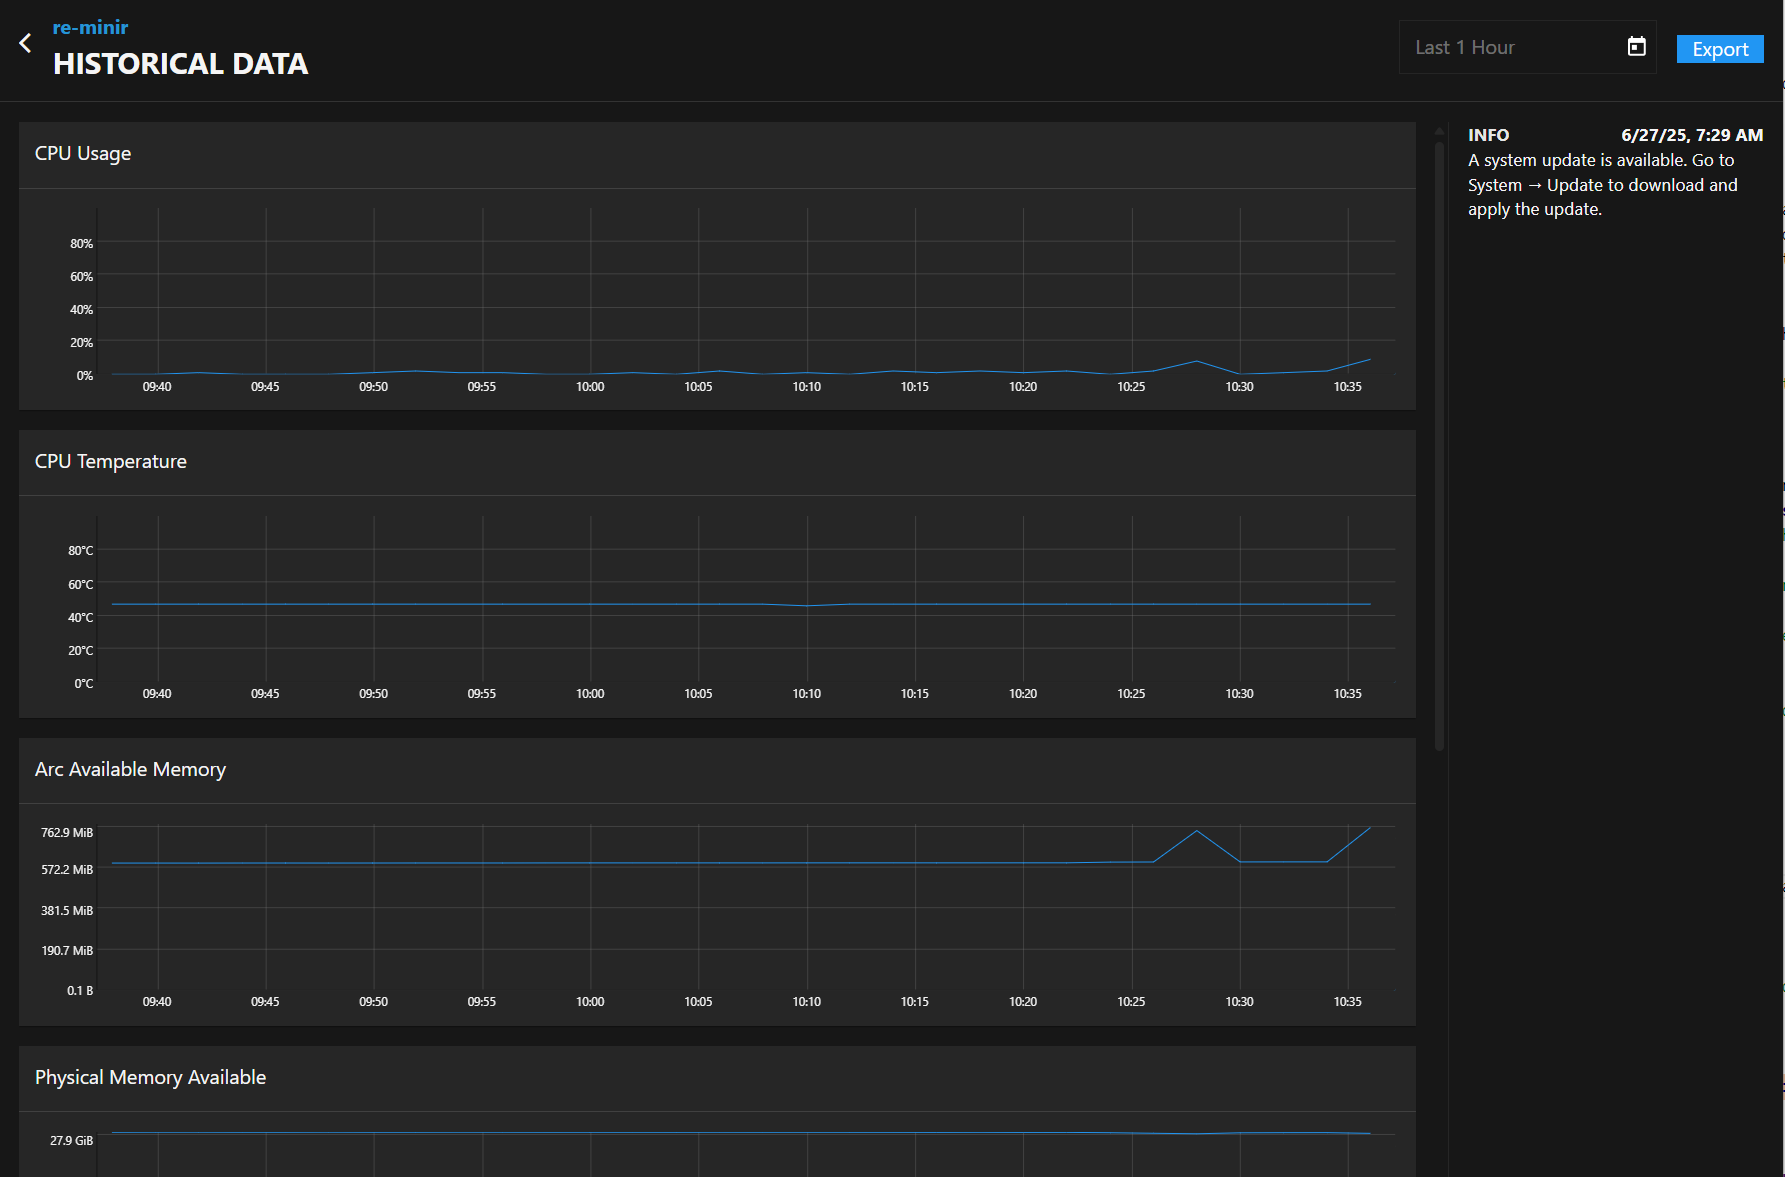
The system information screen, accessed by clicking on the system name, shows more information on the measurements in these graphs.
Pool Graphs
Storage bar graphs show available storage in TiB and the percentage used for each pool. AppsPoolGG and AppPoolGG2 shows storage for applications. PassEncrypted Pool shows storage for any encrypted pools.
System Status and Information
The system status fields at the bottom of the system card:
- Tags - Shows the tag(s) applied to the system.
- Model - Shows the model number for the TrueNAS system.
- Version - Shows the current TrueNAS release for the system, and an update indicator when an update is available.
- Uptime - Shows the days, hours, minutes, and seconds from the last time the system restarted.
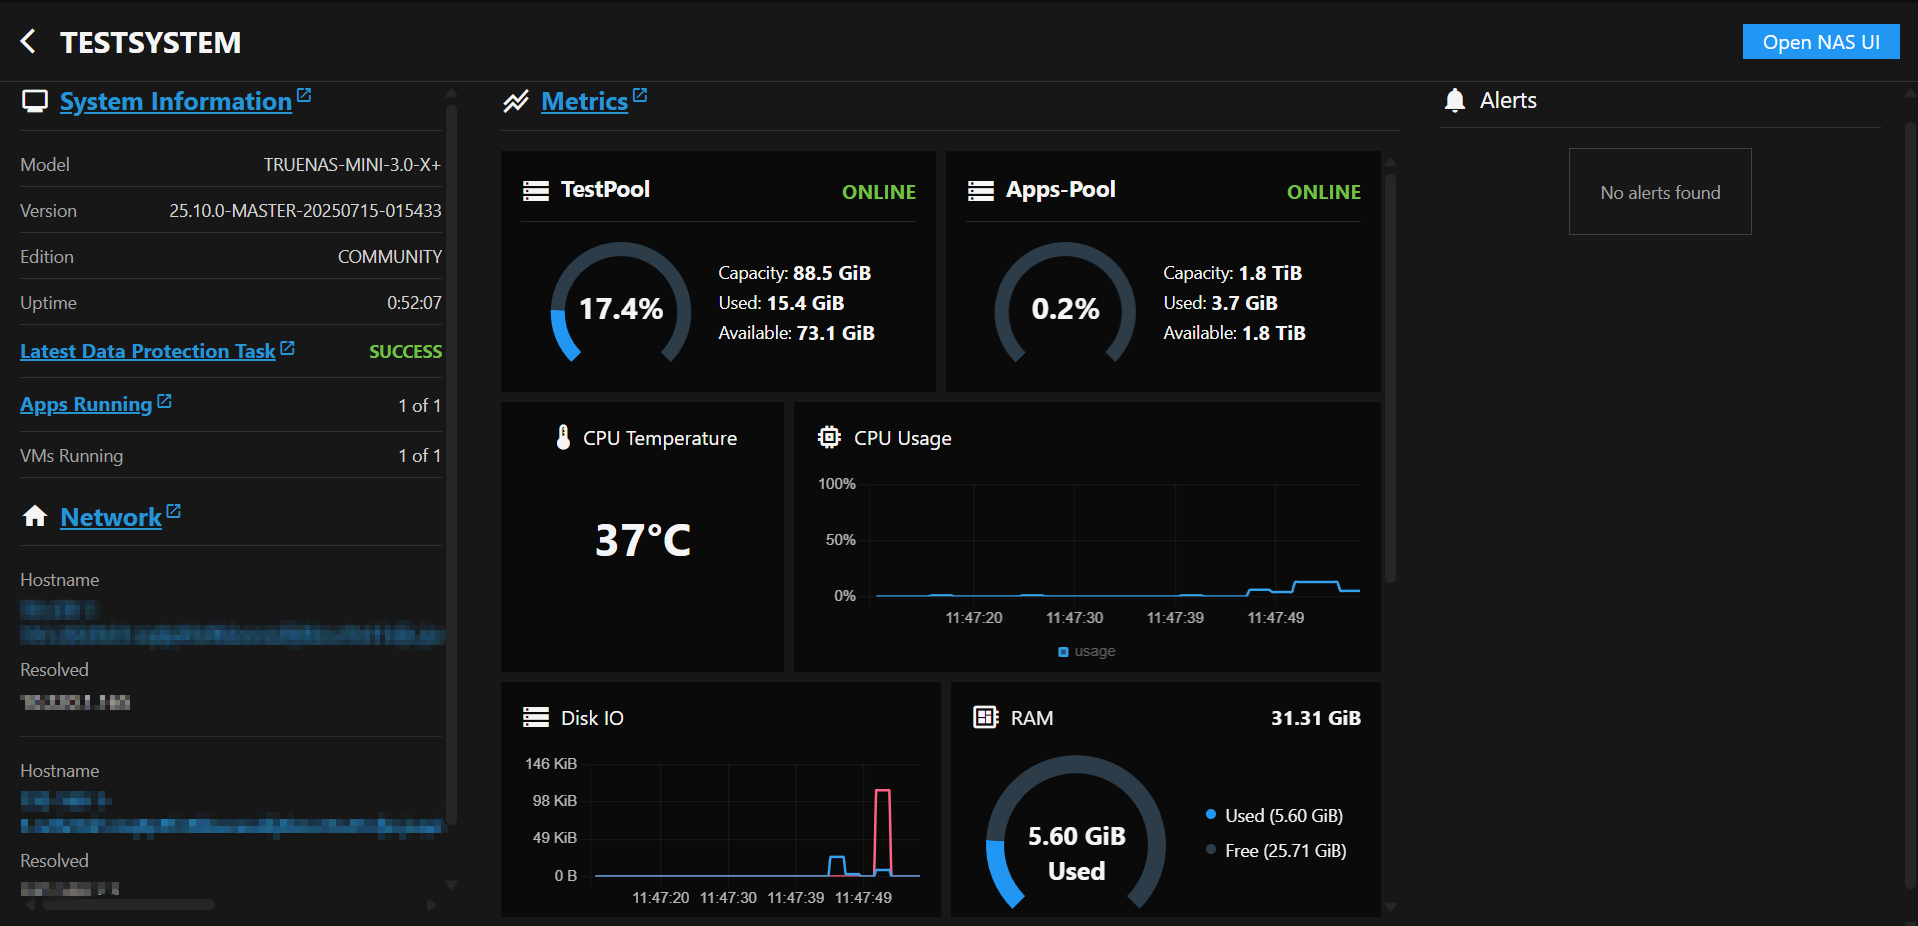
System Information Screen
The name of each system added to TrueNAS Connect opens a system information screen.
Each system information card shows four areas:
- System Information
- Network
- Metrics
- Alerts
Links to the TrueNAS UI open in a new browser window.
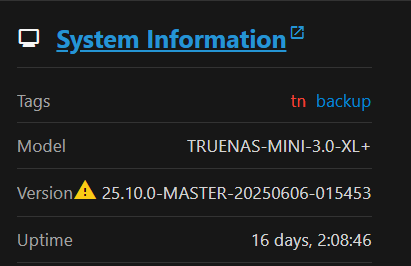
System Information Area
The System Information link opens the Dashboard screen in the TrueNAS UI.
The system status fields in the System Information area show:
- Tags - The tag(s) applied to the system.
- Model - The model number for the TrueNAS system.
- Version - The current TrueNAS release for the system. An update badge indicates when an update is available for the TrueNAS system.
- Uptime - The days, hours, minutes, and seconds from the last time the TrueNAS system restarted.
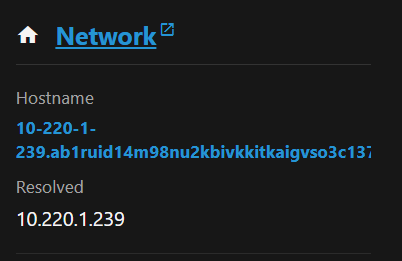
Network Area
The Network link opens the Dashboard screen in the TrueNAS UI.
The Network widget shows two fields:
Resolved shows the IP address of the primary network interface card in the TrueNAS system that is registered in TrueNAS Connect.
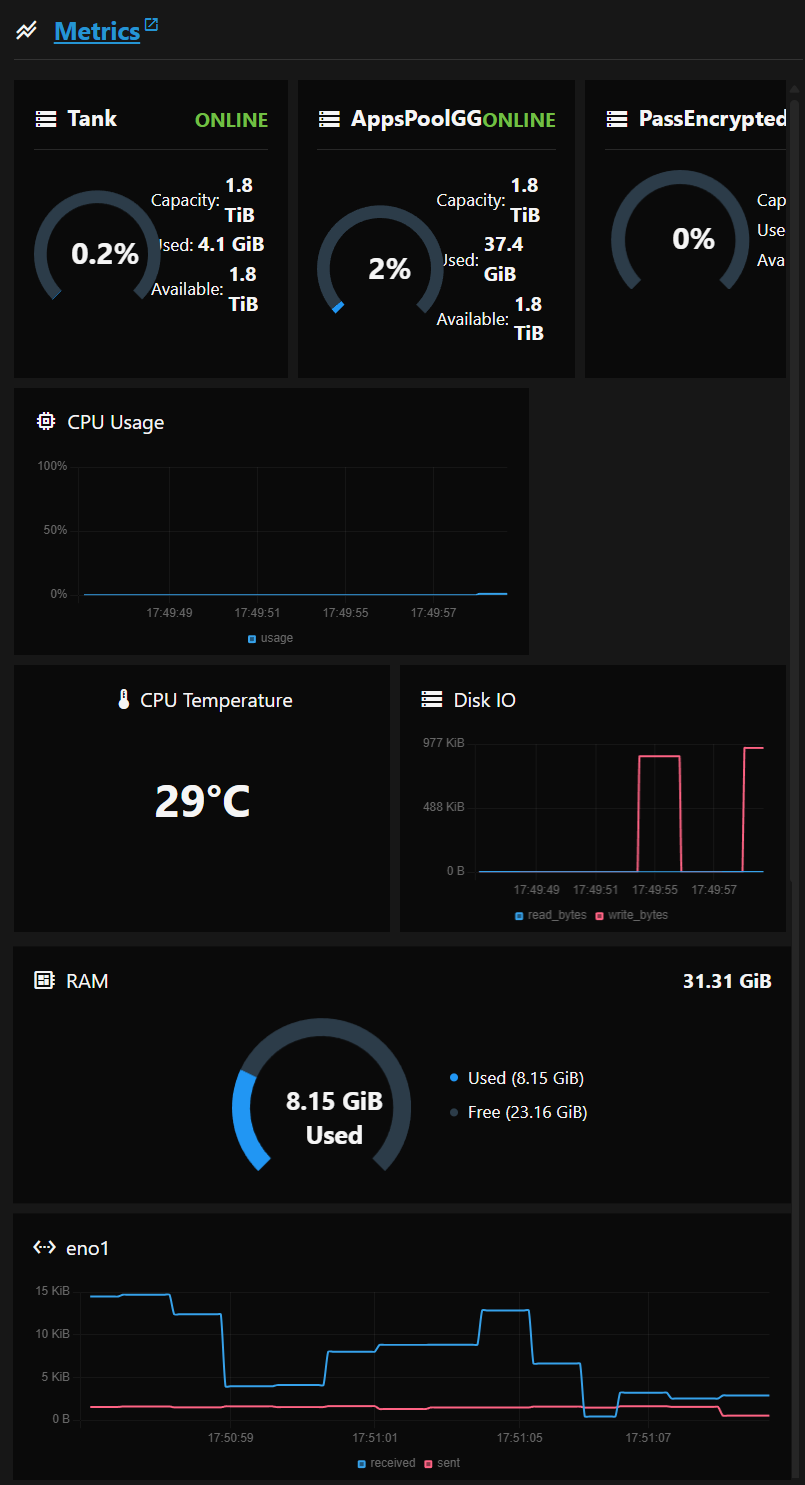
Metrics Panel
The Metrics panel shows real-time graphs of storage, system, and network resources in the TrueNAS system. Note that running TrueNAS in a virtual environment can lead to incorrect or missing metric reports. This link opens the Reporting screen in the TrueNAS UI.
Pool Graphs
TrueNAS Connect shows graphs for each pool in the TrueNAS system, the status of the pools, storage capacity, percent used, and available storage measured in TiB.


