Applications Screen
4 minute read
The TrueNAS Connect Applications screen provides centralized management and monitoring for applications, containers, and virtual machines running on connected TrueNAS systems.
Header Controls
The header section contains navigation functionality and displays screen identification.
Apps Section
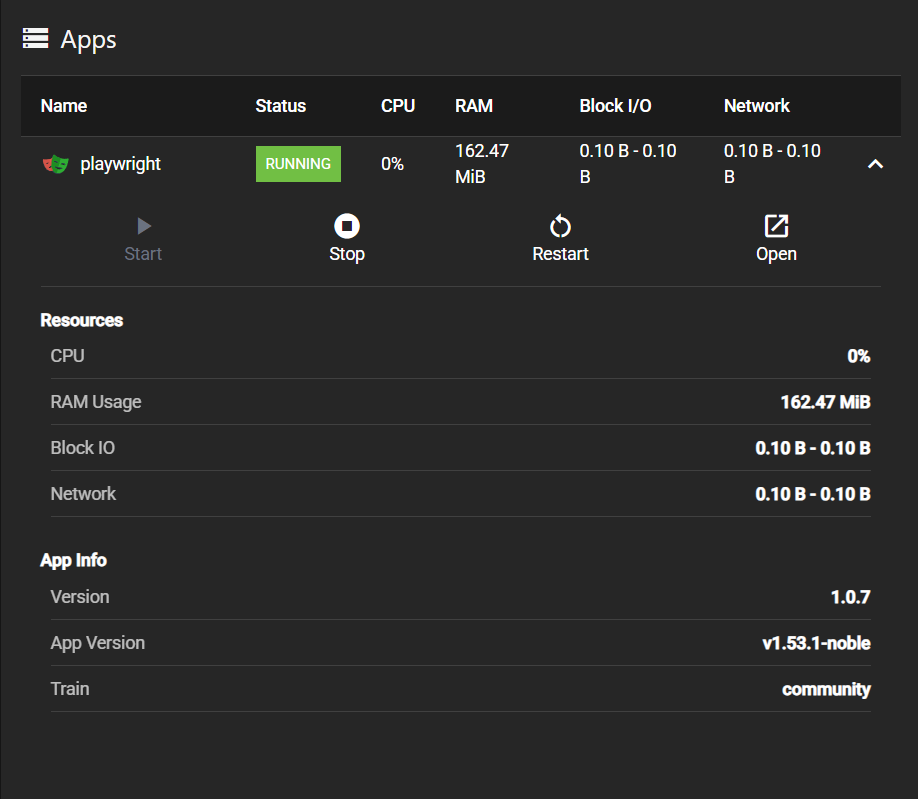
Apps displays and manages installed applications on the TrueNAS system.
Apps Table
Expandable table component displaying all installed applications with the following columns:
- Name: Application name and identifier
- Status: Current operational state of the application
- CPU: Processor utilization percentage
- RAM: Memory consumption in MB or GB
- Block I/O: Storage input/output activity metrics
- Network: Network traffic statistics for the application
The expand button in each table row reveals detailed application information and management options.
Expanded App Details
When an application row is expanded, the App Details section displays comprehensive information and management controls for the selected application.
Application Actions
Action buttons provide direct control of applications:
- Start starts a stopped application (disabled when already running)
- Stop stops a running application
- Restart restarts the application with current configuration
- Open opens the application’s web interface in a new tab
Resources Section
Resources displays real-time performance metrics for the application:
- CPU: Current processor utilization percentage (0%)
- RAM Usage: Memory consumption in MiB or GiB (159.44 MiB)
- Block IO: Storage input/output activity in bytes (0.10 B - 0.10 B)
- Network: Network traffic statistics showing inbound and outbound data (198.00 B - 198.00 B)
Containers Section
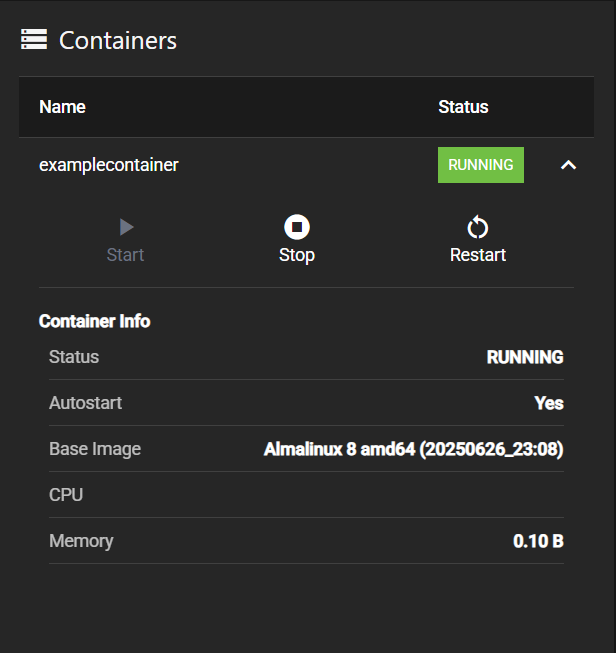
Containers displays and manages Docker containers running on the system.
Expanded Container Details
When a container row is expanded, the Container Details section displays comprehensive information and management controls for the selected container.
Container Actions
Action buttons provide direct control of containers:
- Start starts a stopped container (disabled when already running)
- Stop stops a running container
- Restart restarts the container with current configuration
Container Info Section
Container Info displays container metadata and configuration details:
- Status: Current operational state (RUNNING, ERROR)
- Autostart: Indicates whether the container starts automatically (Yes)
- Base Image: Operating system image and version (Almalinux 8 amd64 (20250626_23:08))
- CPU: Allocated CPU cores or utilization
- Memory: Memory allocation or usage (0.10 B)
Virtual Machines Section
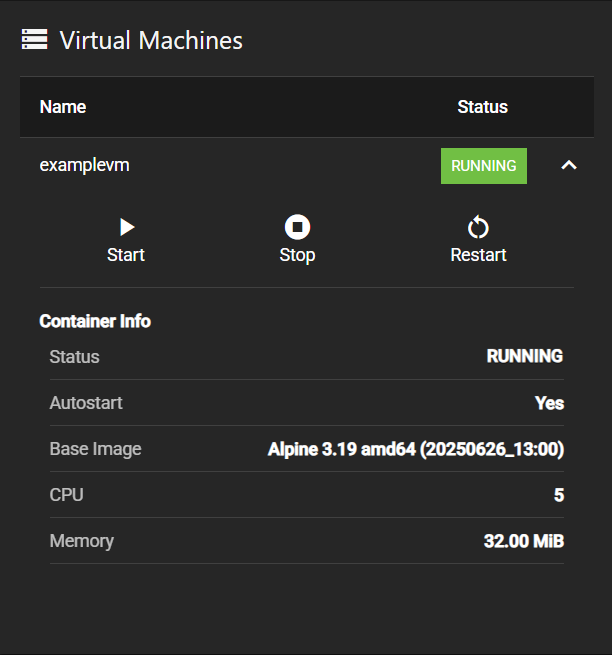
Virtual Machines displays and manages virtual machines configured on the system.
Expanded Virtual Machine Details
When a virtual machine row is expanded, the VM Details section displays comprehensive information and management controls for the selected virtual machine.
Virtual Machine Actions
Action buttons provide direct control of virtual machines:
- Start starts a stopped virtual machine
- Stop stops a running virtual machine
- Restart restarts the virtual machine with current configuration
Virtual Machine Info Section
Container Info (note: VMs use the same component as containers) displays virtual machine metadata and configuration details:
- Status: Current operational state (RUNNING, ERROR)
- Autostart: Indicates whether the VM starts automatically (Yes)
- Base Image: Operating system image and version (Alpine 3.19 amd64 (20250626_13:00))
- CPU: Allocated CPU cores (5)
- Memory: Memory allocation (32.00 MiB)


