This is the multi-page printable view of this section. Click here to print.
Welcome to TrueNAS Connect
- 1: Essentials
- 1.1: Getting Started
- 1.2: Health Reporting
- 1.3: TrueNAS Management
- 1.4: Web Install
- 2: Tutorial
- 2.1: Getting Started with TrueNAS Connect
- 2.2: Health Reporting
- 2.3: Managing the Keyring
- 2.4: Managing TrueNAS Systems Inventory
- 2.5: Managing Virtualization
- 2.6: TrueNAS Web Install
- 3: How-To
- 3.1: Add Notification Tasks
- 3.2: Customize Your Account
- 3.3: Export Inventory Data
- 3.4: Report Bugs and Provide Feedback
- 3.5: Use Enclosure Maps
- 4: Reference
- 4.1: Access Screen
- 4.2: Applications Screen
- 4.3: Dashboard Screen
- 4.4: Enclosures Screen
- 4.5: Historical Data Screen
- 4.6: Inventory Screen
- 4.7: Keyring Screen
- 4.8: Notification Tasks Screen
- 4.9: Profile Screen
- 4.10: Tags Screen
- 4.11: Top Toolbar
Welcome to the TrueNAS Connect documentation! This documentation covers everything you need to know to start managing your TrueNAS system(s) with TrueNAS Connect.
What is TrueNAS Connect?
Is TrueNAS Connect right for you?
TrueNAS Connect simplifies TrueNAS software management with a unified web interface for monitoring and controlling your systems. Instead of tracking multiple IP addresses and logging into individual systems, get centralized visibility and convenient control from any device.
Whether you’re managing a single system or overseeing an enterprise deployment across multiple locations, TrueNAS Connect makes it easy with straightforward OAuth authentication, proactive health monitoring with customizable alerts, and comprehensive management capabilities.
Ready to get started?
You can explore this documentation by key tasks in Essentials or browse by content type below.
1 - Essentials
1.1 - Getting Started
Introduction
TrueNAS Connect simplifies system management with a unified web interface for monitoring and controlling your TrueNAS software. Getting started requires only administrator access to your systems and an OAuth account—no additional hardware or complex setup.
The setup process guides you through system registration and security configuration, then provides a centralized dashboard for day-to-day tasks with convenient access to system information from a single location.
Contents
Getting Started with TrueNAS Connect
TrueNAS Connect quickstart guide.
Managing the Keyring
Learn how to create, manage, and use the TrueNAS Connect keyring for secure API key storage and automatic system authentication.
Customize Your Account
How to view your profile information and customize your avatar in TrueNAS Connect.
Dashboard Screen
Description of the TrueNAS Connect main Dashboard screen, system cards, tag and inventory quick views, dialogs, and fields.
Top Toolbar
Description of the TrueNAS Connect top toolbar and main menu options..
Profile Screen
Reference guide for the TrueNAS Connect Profile screen interface elements and functionality.
Keyring Screen
Reference guide for the TrueNAS Connect Keyring screen interface elements and operations.
End User License Agreement (EULA)
TrueNAS Connect Terms of Service (EU GDPR-Compliant)
1.2 - Health Reporting
Overview
TrueNAS Connect delivers comprehensive health reporting with real-time visibility into system status, performance metrics, and critical events. Track key metrics including CPU usage, temperature, disk I/O, memory utilization, and storage capacity while highlighting critical alerts and offline disk conditions—giving you peace of mind that your infrastructure is healthy.
Stay ahead of potential issues with customizable alerts that deliver notifications via email, SMS, Slack, or PagerDuty. With historical data retention for paid accounts, you can analyze trends over time, while all users benefit from immediate alert visibility without manually checking individual systems.
Contents
Health Reporting
Monitor your system(s) status, alerts, and performance with built-in health features.
Add Notification Tasks
How to configure notification tasks in TrueNAS Connect for proactive monitoring.
Historical Data Screen
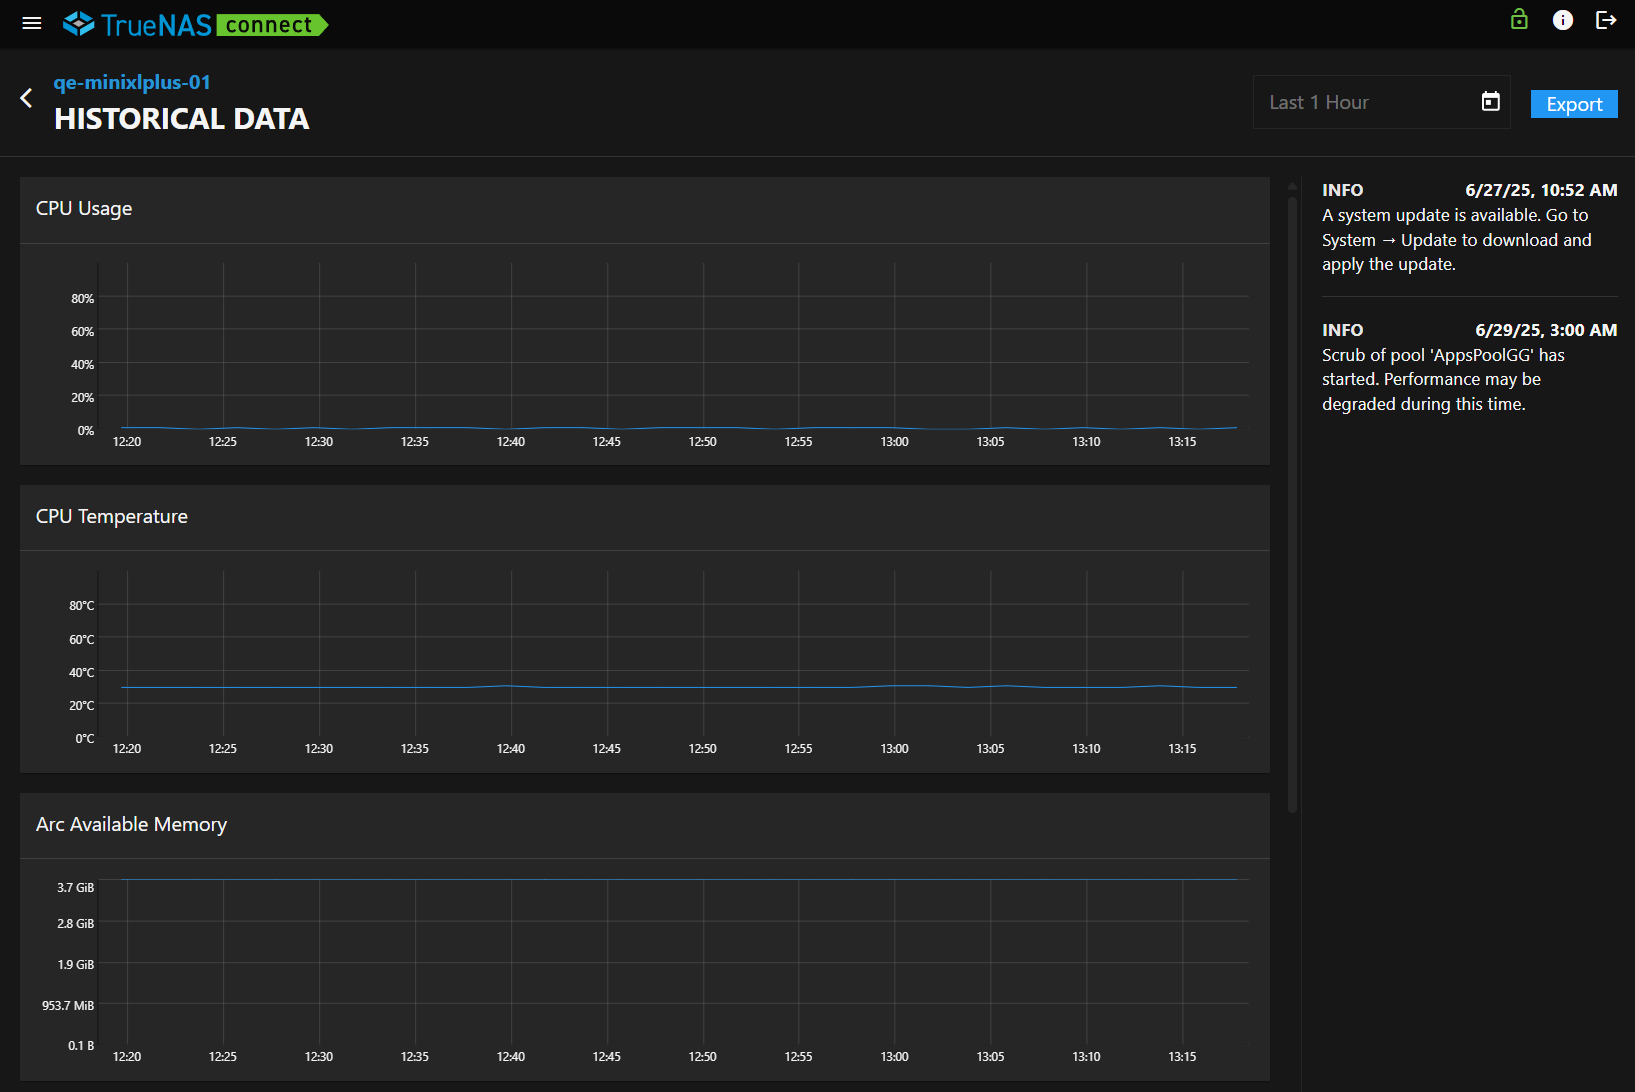
Description of the TrueNAS Connect Historical Data screen, graphs, dialogs, and fields.
Notification Tasks Screen
Reference guide for the TrueNAS Connect Notification Tasks screen interface elements and functionality.
1.3 - TrueNAS Management
Introduction
TrueNAS Connect provides centralized monitoring and coordination for your TrueNAS software from a single web interface. While detailed configuration happens in individual system interfaces, TrueNAS Connect gives you convenient visibility into hardware inventory, system health, and key metrics across all your systems.
Monitor real-time system status, track storage devices across multiple systems, manage alert notifications for critical events, and export detailed inventory reports. These tools provide streamlined oversight for day-to-day operations so you can focus on keeping your systems running smoothly.
Contents
Managing TrueNAS Systems Inventory
View and manage hardware information, disk details, and system specifications across all connected TrueNAS systems
Managing the Keyring
Learn how to create, manage, and use the TrueNAS Connect keyring for secure API key storage and automatic system authentication.
Managing Virtualization
Learn how to view, monitor, and control virtual machines in TrueNAS Connect through the Applications screen interface.
Export Inventory Data
How to export TrueNAS systems inventory data from TrueNAS Connect for reporting, analysis, or record-keeping.
Use Enclosure Management
How to use the TrueNAS Connect Enclosures screen for personalized enclosure mapping, planning, and visualization.
Dashboard Screen
Description of the TrueNAS Connect main Dashboard screen, system cards, tag and inventory quick views, dialogs, and fields.
Tags Screen
Description of the TrueNAS Connect Tags screen, settings, and tag functions.
Access Screen
Reference guide for the TrueNAS Connect Access screen, settings, and fields.
Notification Tasks Screen
Reference guide for the TrueNAS Connect Notification Tasks screen interface elements and functionality.
Historical Data Screen
Description of the TrueNAS Connect Historical Data screen, graphs, dialogs, and fields.
Inventory Screen
Reference guide for the TrueNAS Connect Inventory screen interface elements and functionality.
Keyring Screen
Reference guide for the TrueNAS Connect Keyring screen interface elements and operations.
Enclosures Screen
Reference guide for the TrueNAS Connect Enclosures screen interface elements and functionality.
1.4 - Web Install
Introduction
TrueNAS Connect streamlines deployment by allowing you to install TrueNAS through the web interface without requiring physical access. After preparing installation media and booting the system, TrueNAS Connect handles the workflow remotely from your browser.
While initial steps like creating installation media and booting require local access, you can complete the installation and setup entirely through the TrueNAS Connect interface—detecting the system ready for installation and guiding you through registration and configuration.
Contents
TrueNAS Web Install
Learn how to install TrueNAS through the TrueNAS Connect web-based installation feature.
2 - Tutorial
2.1 - Getting Started with TrueNAS Connect
Accessing TrueNAS Connect for the first time is as easy as clicking on the Status of TrueNAS Connect icon located in the top toolbar of your TrueNAS system UI. All that is required is full administration access to the TrueNAS server and an OAuth account.
Your system must be using 25.10.1 or later to use TrueNAS Connect.
Setting Up TrueNAS Connect
Begin by logging into the TrueNAS server as an administrator. After logging into your TrueNAS system as a full administrator, click on the TrueNAS Connect icon to open the TrueNAS Connect dialog.
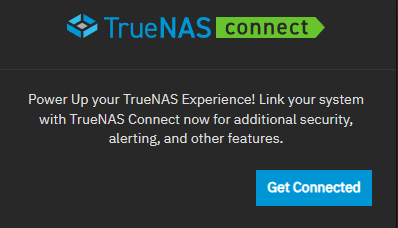
Before you sign up for TrueNAS Connect, the dialog shows it is waiting to connect.
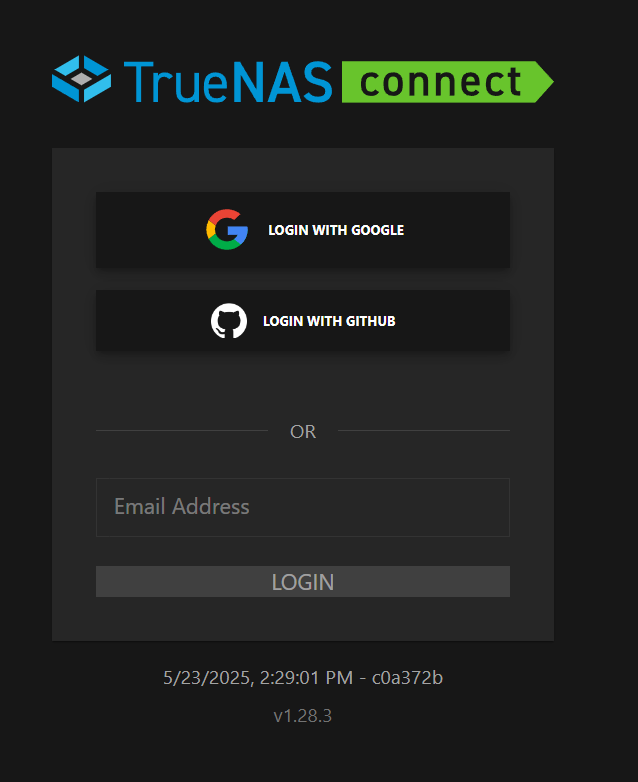
Click Get Connected to open the TrueNAS Connect login screen.
Choose the OAuth provider you want to use to log into TrueNAS Connect. The OAuth account used is registered as the authentication account for TrueNAS Connect.
You can use an existing OAuth account or create a new account. The option to use an email account is planned for a future update.
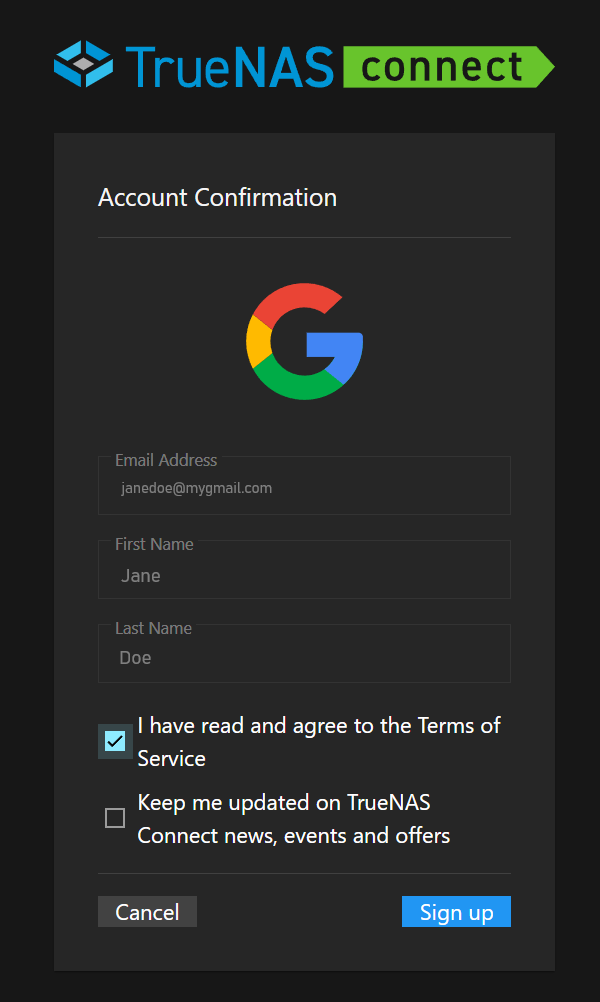
Follow the sign-in process for your chosen OAuth provider until you reach the Account Confirmation window. Click the link on the Account Confirmation window to view the Terms of Service.
Read the Terms of Service, then select the option to indicate that you read and agree to the Terms of Service.
Select the option to receive updates on TrueNAS Connect news, events, and offers to receive notifications from TrueNAS Connect.
Click Sign Up to open the TrueNAS Connect Dashboard.
TrueNAS Connect prompts you to complete the system registration and add the system to TrueNAS Connect. After adding the system, a system information card shows on the main Dashboard screen.
Repeat this process for each TrueNAS system you want to add to TrueNAS Connect.
After adding your system, you can customize the interface.
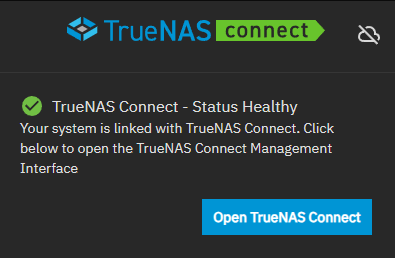
On TrueNAS, after connecting to TrueNAS Connect and registering the system, the Status of TrueNAS Connect icon shows an active status indicator. The TrueNAS Connect dialog shows the status of the active connection.
Click Open TrueNAS Connect to open the TrueNAS Connect management interface. Click cloud_off Disable Service to disconnect the system from TrueNAS Connect.
Logging In Using a Google Account
To sign into TrueNAS Connect with a Google account, click Login with Google. The Sign In with Google window opens. Choose the Google account you want to use to register your system in TrueNAS Connect.
If using an existing Google account, enter the email or phone number and click Continue. Select the existing Google account to use for the TrueNAS Connect authentication and credentials to log into TrueNAS Connect. Confirm the account on the Account Confirmation window as described above in Setting Up TrueNAS Connect.
If creating a new account, click Create Account and follow the Google account creation process until you reach the Account Confirmation window for TrueNAS Connect.
After completing the account confirmation, the TrueNAS Connect main Dashboard shows and prompts you to register your system.
Logging In Using a GitHub Account
To sign into TrueNAS Connect with a GitHub account, click Login with GitHub. The Select user to authorize window opens. Sign in with your existing GitHub account or click Use a different account to choose an account or create a new Google account.
If you are using an existing GitHub account, enter the user account name or the email associated with the account, then click Sign In. Follow the GitHub authentication process until the Account Confirmation window shows. Confirm the account on the Account Confirmation window as described above in Setting Up TrueNAS Connect.
If creating a new account, follow the GitHub account creation process until you see the Account Confirmation window for TrueNAS Connect. After completing the account confirmation, the TrueNAS Connect main dashboard opens, and the system prompts you to register your system.
Registering a System
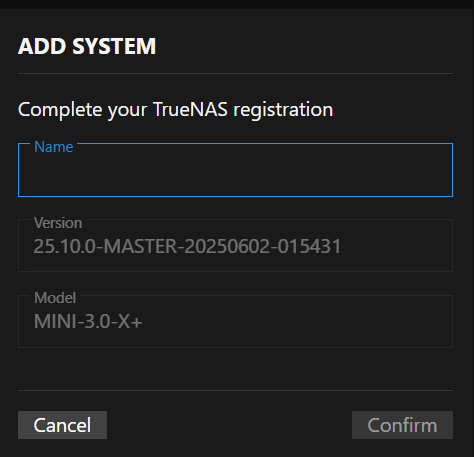
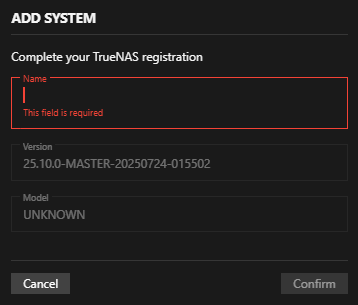
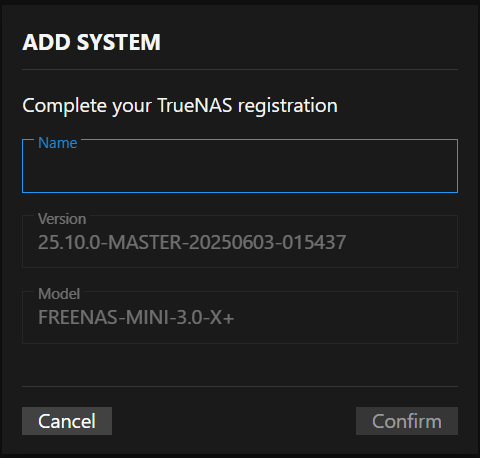
After logging into TrueNAS Connect, you are prompted to complete the system registration using the Add System dialog.
Enter a name for your system, such as the host name or a name that helps identify the purpose of the system. For example, backup1, TNserver1, etc. Click Confirm to add the system.
To register another system, begin in the TrueNAS system UI. Log in to the TrueNAS system UI as an administrator with full admin privileges. Follow the instructions provided in Setting Up TrueNAS Connect to log into TrueNAS Connect using the same OAuth account used to set up TrueNAS Connect.
Repeat this for each system you want to add to TrueNAS Connect.
Adding a Keyring
Keyrings are useful for quickly authenticating your TrueNAS servers with an API key.
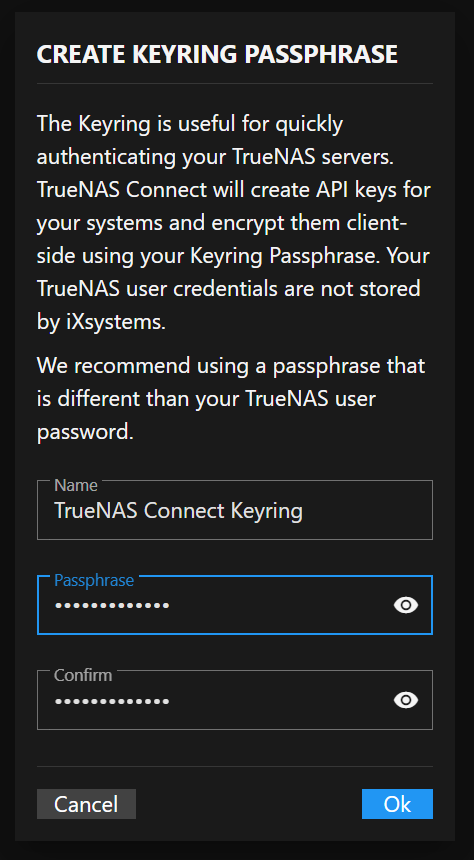
To add a keyring, click Create Keyring. The Create Keyring Passphrase window opens.
Enter a strong passphrase in Passphrase and re-enter it in Confirm. Click OK to add the keyring.
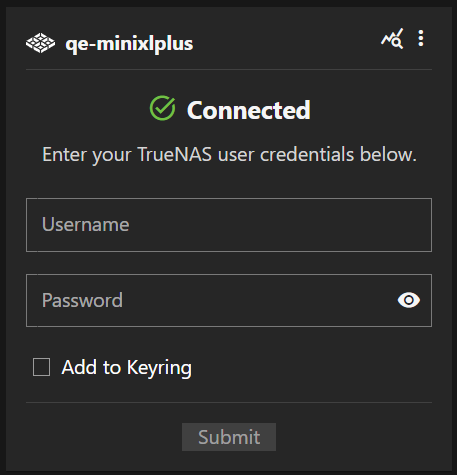
You can apply one keyring to all your systems. Select the Add to Keyring option on the system card where you enter the credentials to log into each system.
Unlocking a System
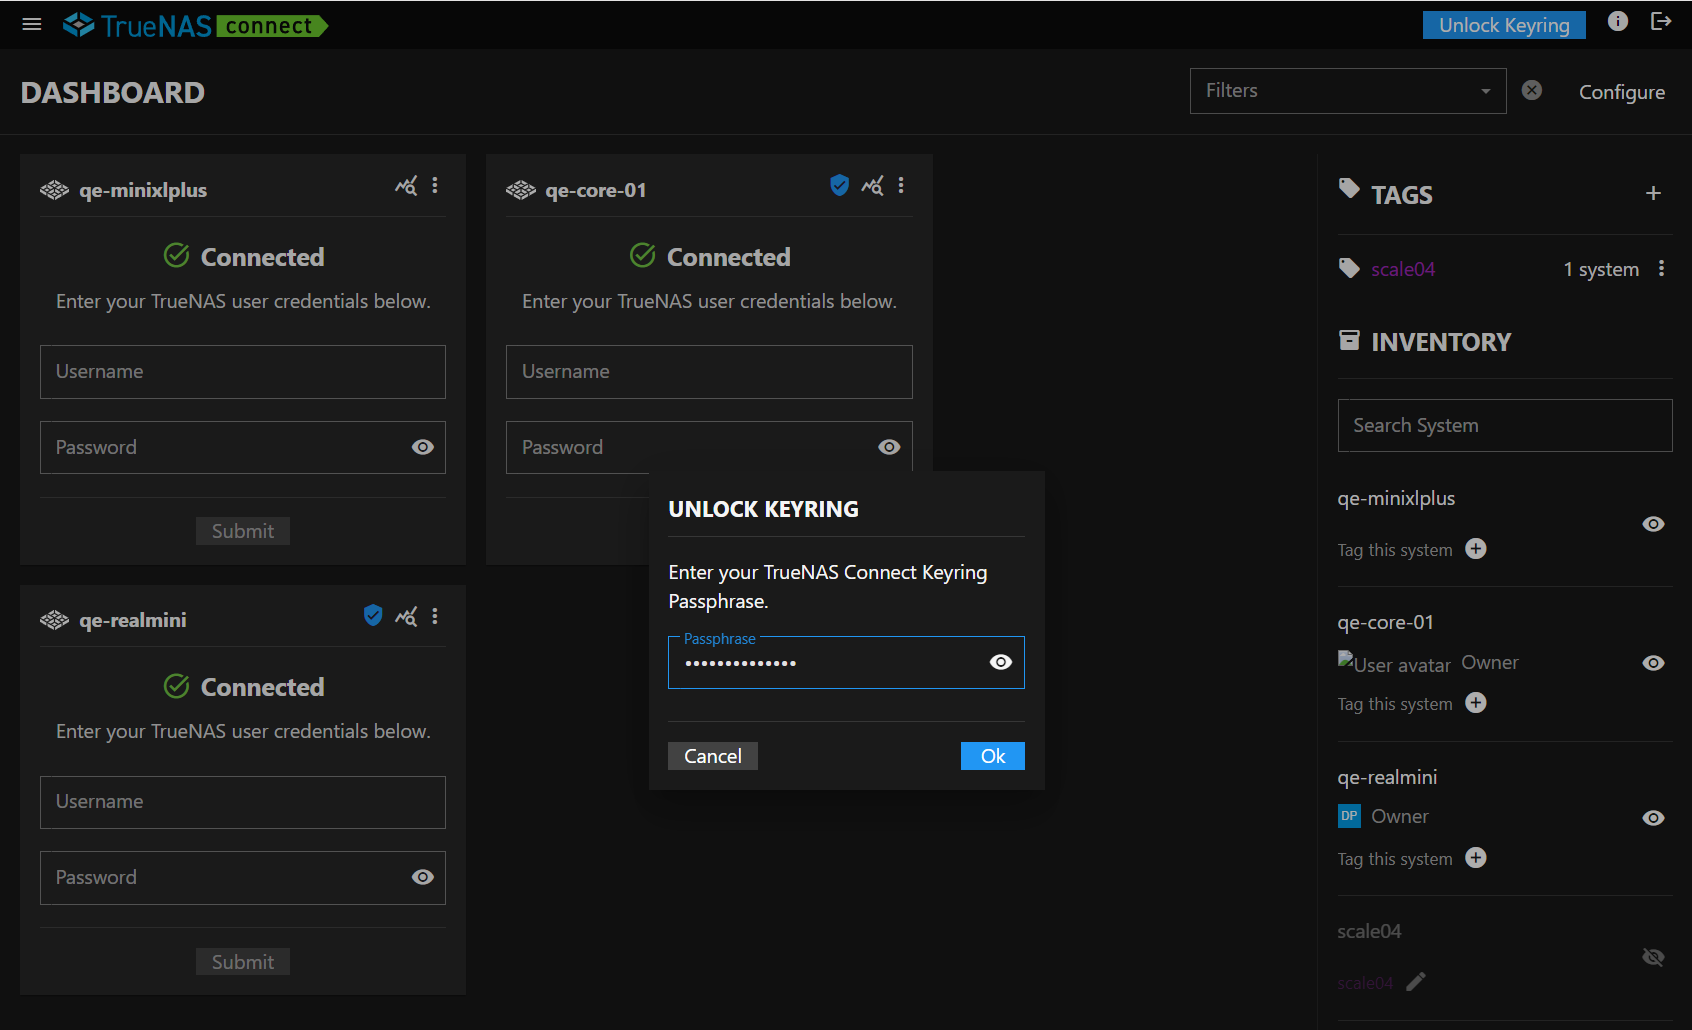
After logging out of TrueNAS Connect, the Unlock Keyring dialog shows when you sign in again. Enter your passphrase for the keyring to authenticate system access. If you include other systems in the keyring, each included system is authenticated with the keyring. Authenticated systems show the system cards populated with information received from the TrueNAS on the Dashboard.
Customizing TrueNAS Connect
Customizing the Dashboard
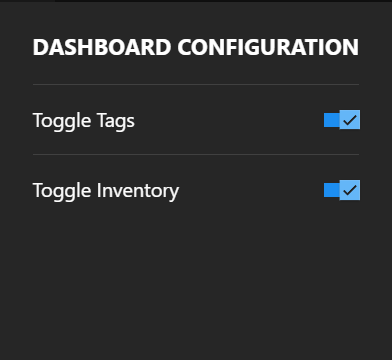
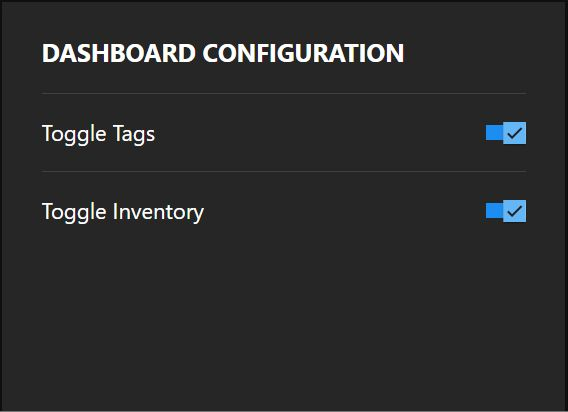
You can customize the main Dashboard to show the Tags and/or Inventory widgets. Click Configure at the top right of the main dashboard screen to show the Dashboard Configuration dialog.
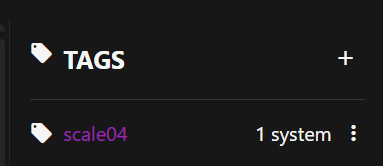
Select Toggle Tags to show or hide the Tags widget. Tags lists system tags created in TrueNAS Connect, and an option to add tags for other systems. If you hide the Tags widget, you can add tags from the Tags option on the main menu dropdown.
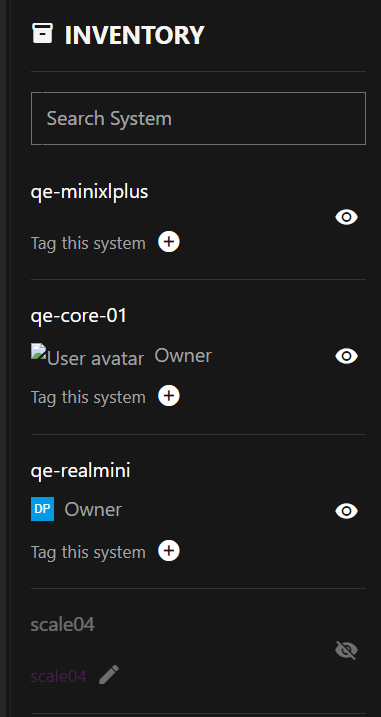
Select Toggle Inventory to show or hide the Inventory widget that lists systems by name on the right side of the dashboard. Each system listed in the Inventory widget shows a Visibility icon that toggles showing or hiding the system information card on the main dashboard.
Customizing Your Profile and Avatar
You can customize your TrueNAS Connect account profile by viewing your account information and setting a custom avatar image.
To access your profile settings, click the Profile option in the main navigation menu.
Viewing Profile Information
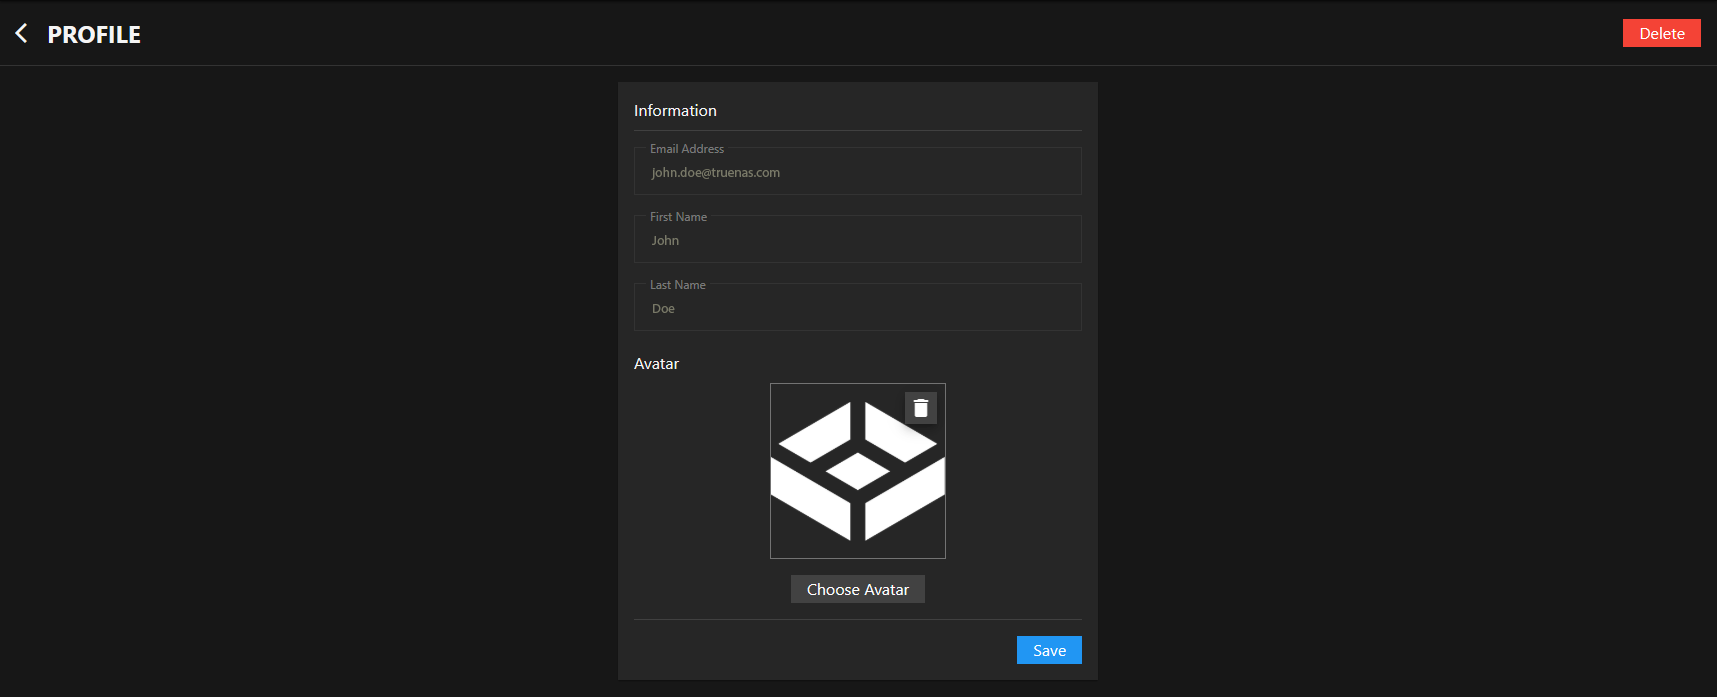
Your profile displays your account information including your email address, first name, and last name.
Profile information fields (Email Address, First Name, and Last Name) are read-only and display the information from your account used to authenticate with TrueNAS Connect.
Setting Your Avatar
You can personalize your TrueNAS Connect account by uploading a custom avatar image.
To upload an avatar:
- In the Avatar section, click Choose Avatar
- Select an image file from your computer (JPG, PNG, or WebP format)
- Click Save to apply your new avatar
Your avatar image appears throughout TrueNAS Connect, including in the main navigation and system cards.
If you want to remove your current avatar, click the button to return to the default profile icon.
Understanding TrueNAS Connect Connection States
TrueNAS Connect uses a secure architecture designed to protect your data and maintain direct control over your systems. All commands that could modify your NAS never touch TrueNAS Connect servers. TNC serves as an authentication service, but all management commands flow directly from your browser to your NAS over your local network.
This design ensures that TrueNAS Connect servers only handle authentication—all management commands go directly from your browser to your NAS. By requiring local network access (or VPN) for these operations, you maintain direct control over your system while still benefiting from centralized monitoring.
This security-focused design results in three possible connection states depending on your network configuration and system status.
State 1: Full Local Access (Recommended)
When you access TrueNAS Connect while connected to the same local network as your NAS (or through a VPN), you experience the complete TrueNAS Connect feature set:
- Real-time system statistics
- Application management
- Replication job management
- System configuration changes
- Full interaction with all features
This is the ideal TrueNAS Connect experience and provides full access to all management capabilities.
Initial system configuration and registration require local network access. You must be on the same network as your TrueNAS system when setting up TrueNAS Connect for the first time.
State 2: Remote Access (Limited Functionality)
When you access TrueNAS Connect from outside your local network without a VPN connection, your NAS remains connected to TrueNAS Connect, but limits functionality:
- Available: Periodic heartbeat updates from your NAS provide basic system statistics
- Unavailable: Commands to your NAS (application management, replication job updates, system configuration changes, etc.)
This state occurs when you access the TrueNAS Connect website away from home or your office network without a configured VPN. Your system remains registered and monitored, but you cannot send commands to the NAS from your browser.
State 3: System Offline
When your NAS cannot communicate with TrueNAS Connect or your browser, the system appears offline in the dashboard. This state typically occurs when:
- You power off the NAS or disconnect it from the network
- The TrueNAS Connect service stops running on the NAS
- Network connectivity issues prevent communication
In this state, TrueNAS Connect cannot display current system information or accept management commands until you restore connectivity.
Network Requirements for Full Functionality
To ensure the complete TrueNAS Connect experience:
- During initial setup: You must be on the same local network as your TrueNAS system to complete registration and configuration.
- For ongoing management: Access TrueNAS Connect from your local network or establish a VPN connection to your network when accessing remotely.
- For monitoring only: Remote access without local network connectivity still provides basic system health monitoring through heartbeat updates.
Understanding Data Collection and Privacy
When you connect your TrueNAS system to TrueNAS Connect, the service collects operational metrics and system health information to provide monitoring, reporting, and management capabilities. This data collection enables features like health dashboards, performance graphs, and proactive alerts.
Collecting System Information
TrueNAS Connect receives the following types of data from your connected systems:
- Storage Metrics - Pool capacity (used and available space), disk read/write operations, and ZFS cache performance statistics
- System Performance - CPU usage and temperature per core, memory utilization, and ARC (cache) statistics
- Network Activity - Network adapter names and data transfer rates (sent/received bytes)
- Application Status - Count of installed and running applications and virtual machines
- System Alerts - Alert messages and severity levels (critical, warning, or informational) generated by your TrueNAS system
This information allows TrueNAS Connect to display real-time system health, generate performance reports, and notify you of issues that require attention.
Protecting Your Private Data
TrueNAS Connect does not have access to:
- Your files, datasets, or any stored data
- User passwords, encryption keys, or API credentials
- The contents of SMB shares, NFS exports, or iSCSI targets
- Network traffic contents or communications
- Personal or business information stored on your TrueNAS systems
- The ability to save installed applications and application names
All collected data consists solely of operational metrics and system status information necessary for monitoring and management.
Securing Data in Transit
Secure WebSocket connections encrypt all data in transit between your TrueNAS system and TrueNAS Connect. For more information about data processing and privacy practices, see the TrueNAS Privacy Policy.
2.2 - Health Reporting
Using Dashboard Reporting Features
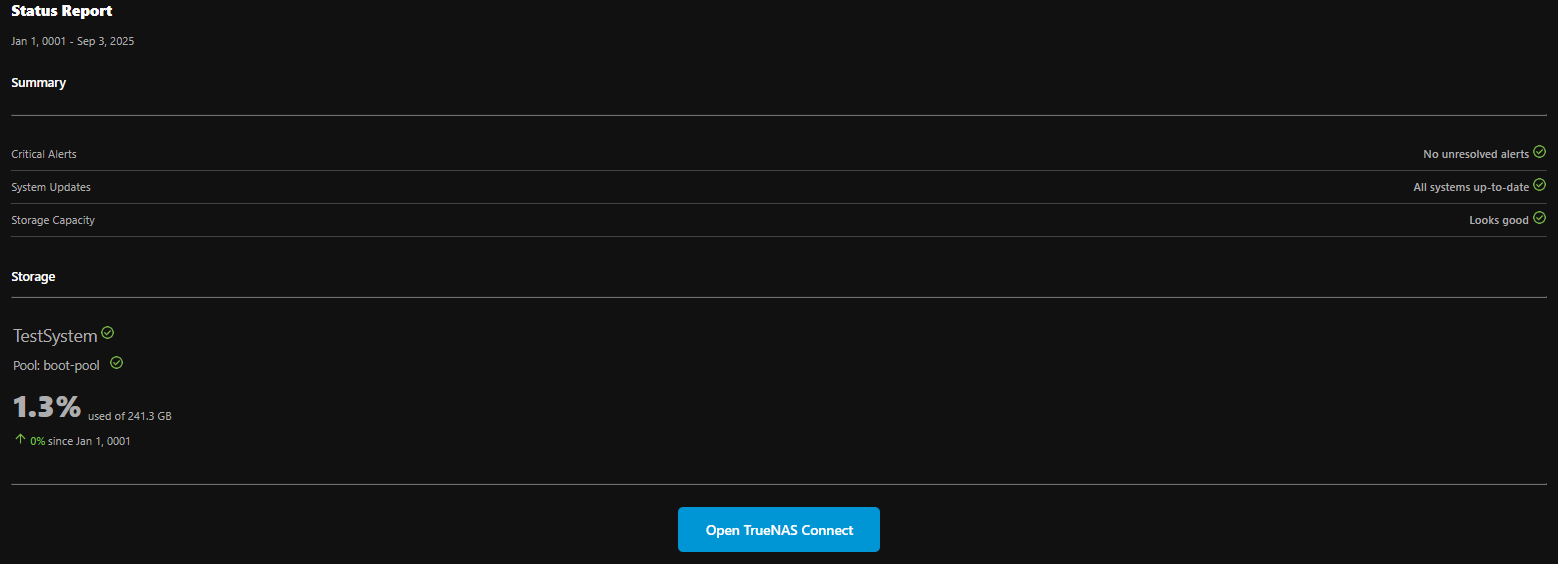
Users can find the system card(s) with health reporting widgets on their TrueNAS Connect dashboard.
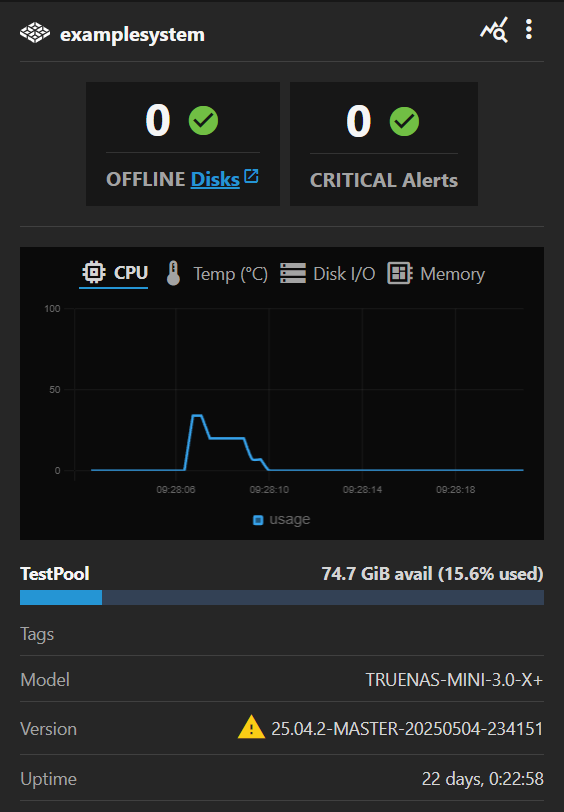
OFFLINE Disks and CRITICAL Alerts statistics are found at the uppermost border of the widget, and can be used to quickly track the number of critical errors on any connected TrueNAS system.
The live-reporting graph defaults to the disk I/O rates, but can be toggled to temperature reporting, CPU usage, and memory usage by clicking the applicable icons.
Below the graph, currentl storage insights for TrueNAS datasets are shown.
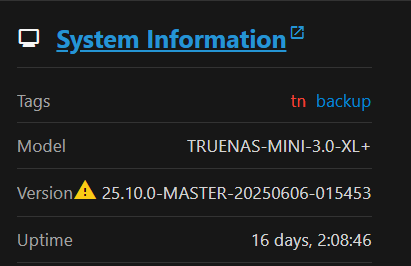
Users can also locate the most recent tags, model, version, and uptime statistics on their TrueNAS systems at the bottom of the dashboard health reporting widget.
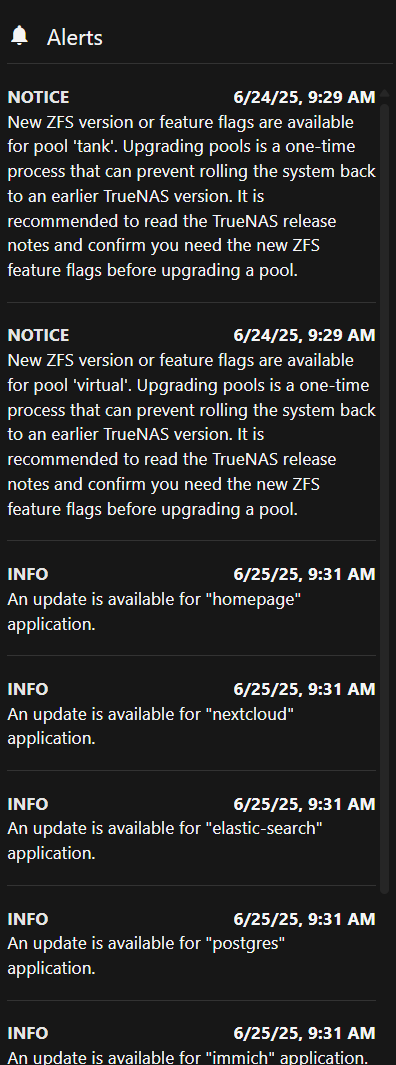
Viewing TrueNAS Alerts
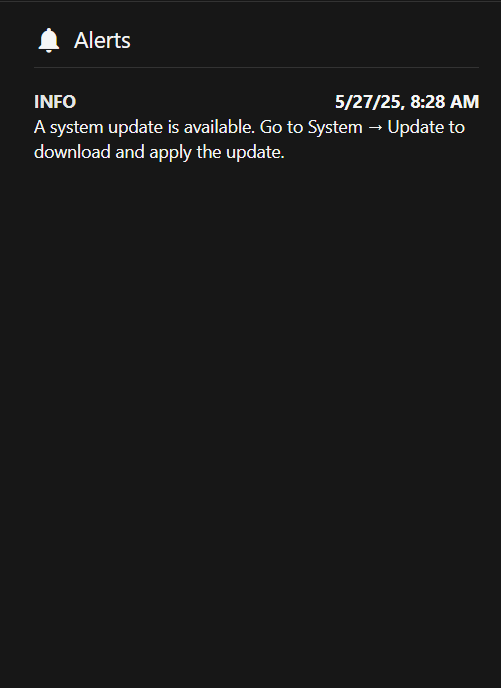
Click CRITICAL Alerts to open the alerts panel for that system. On the far right, all TrueNAS system alerts are available.
Viewing Historical Alert Data
On free-tier TrueNAS Connect accounts, alerts remain in the TrueNAS Connect alert column for as long as the alerts stay in the TrueNAS UI. After alerts are cleared from the TrueNAS UI, they disappear from the TrueNAS Connect alert column.
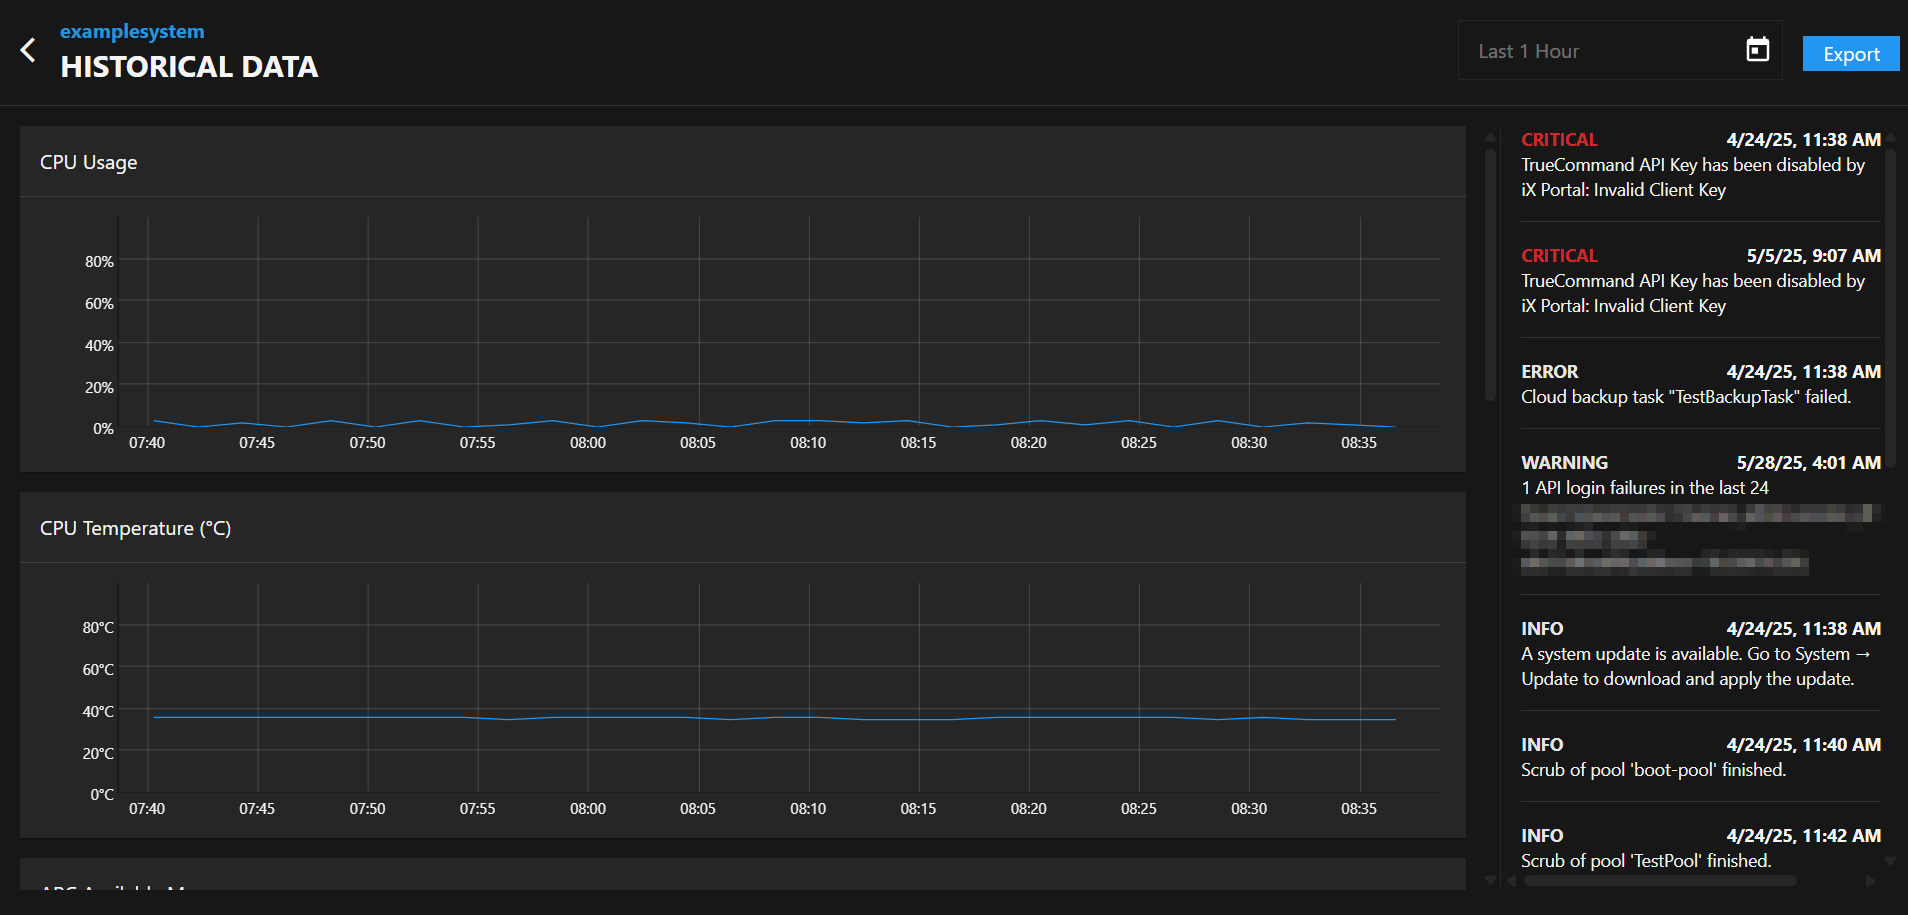
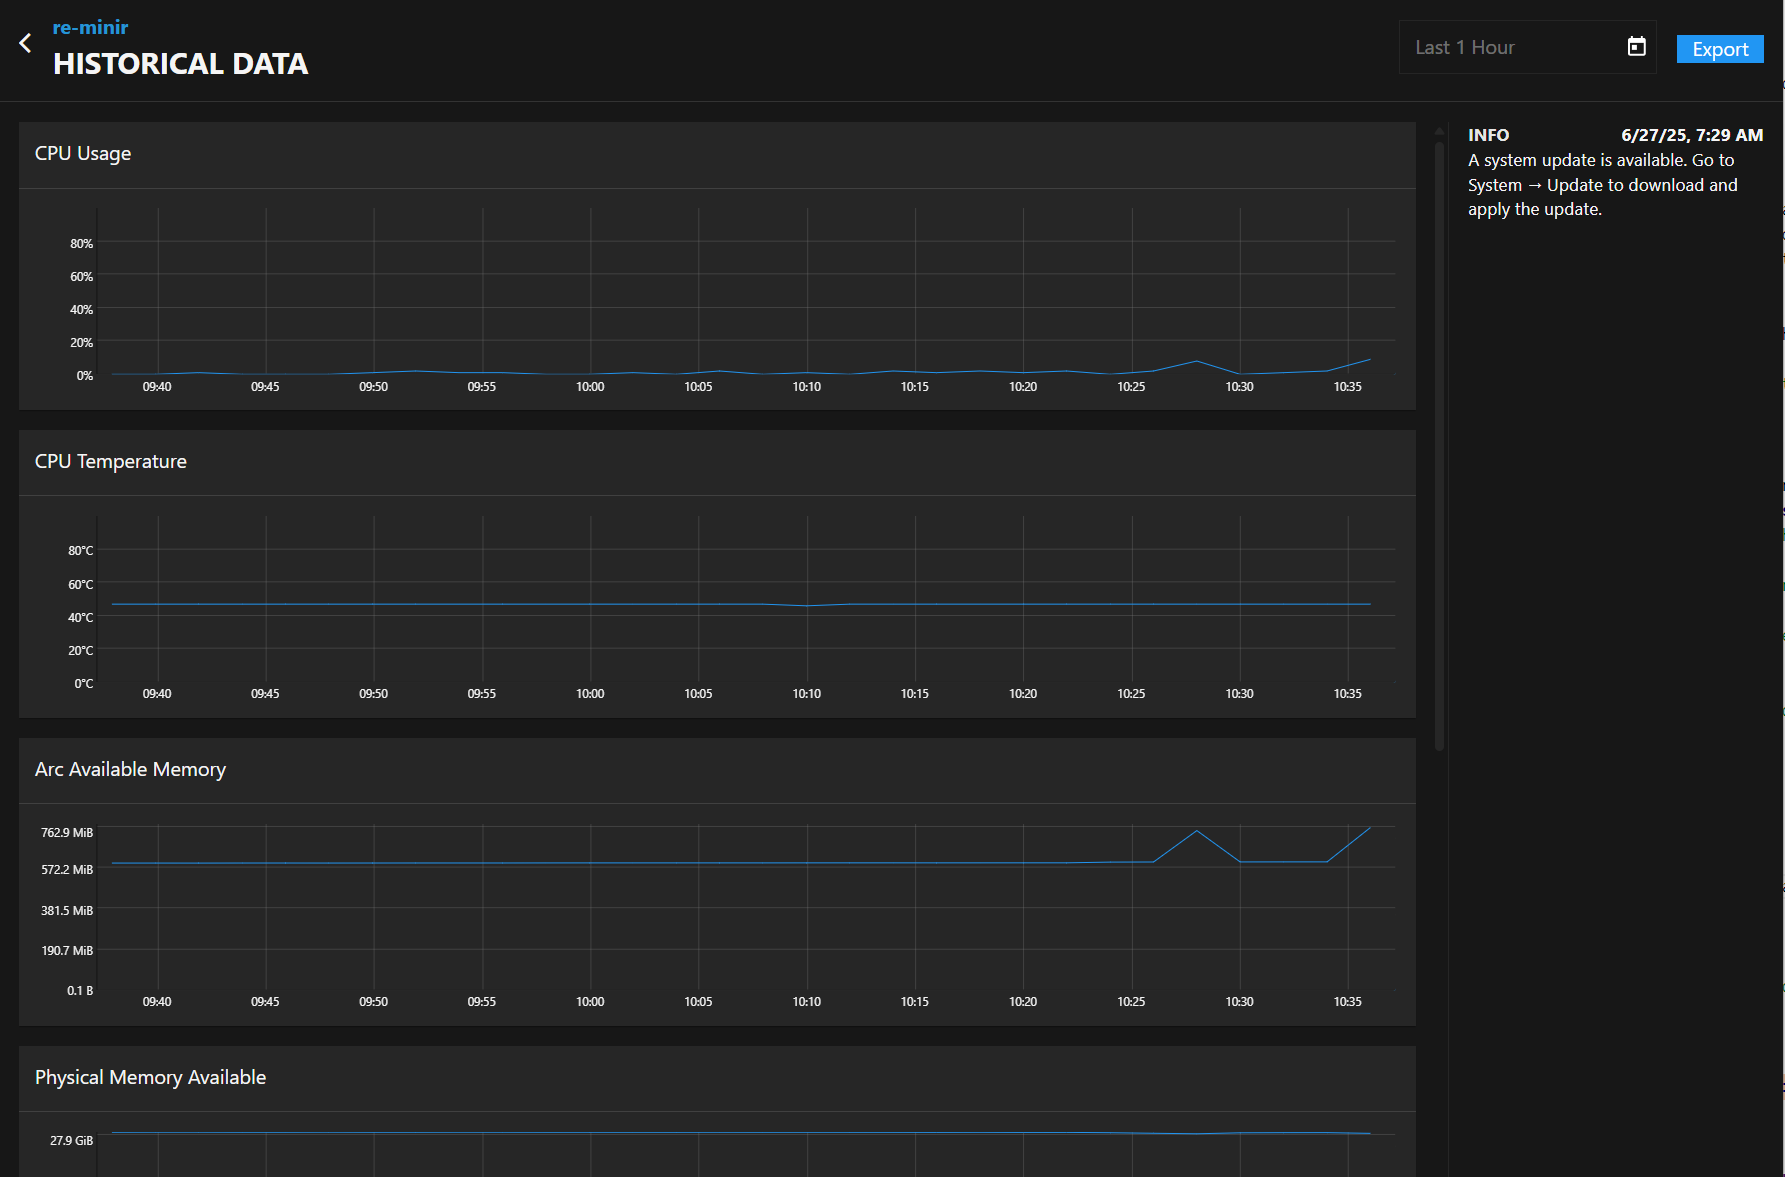
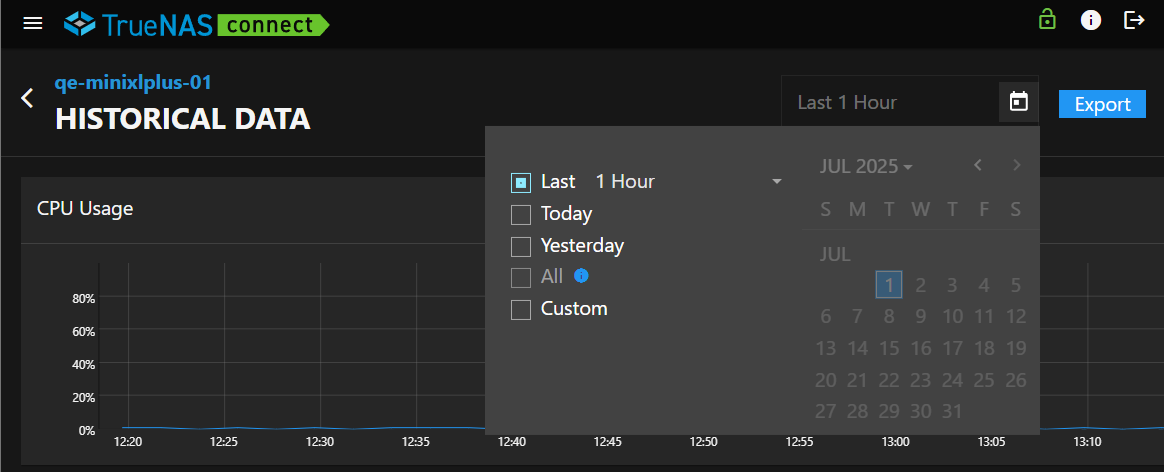
Alert retention periods vary by account tier, with extended historical data available for higher-tier accounts. To locate system Historical Data, click on the icon located in the top right corner of the dashboard system card. From the dropdown menu, click Historical Data.
Using the System Info Screen
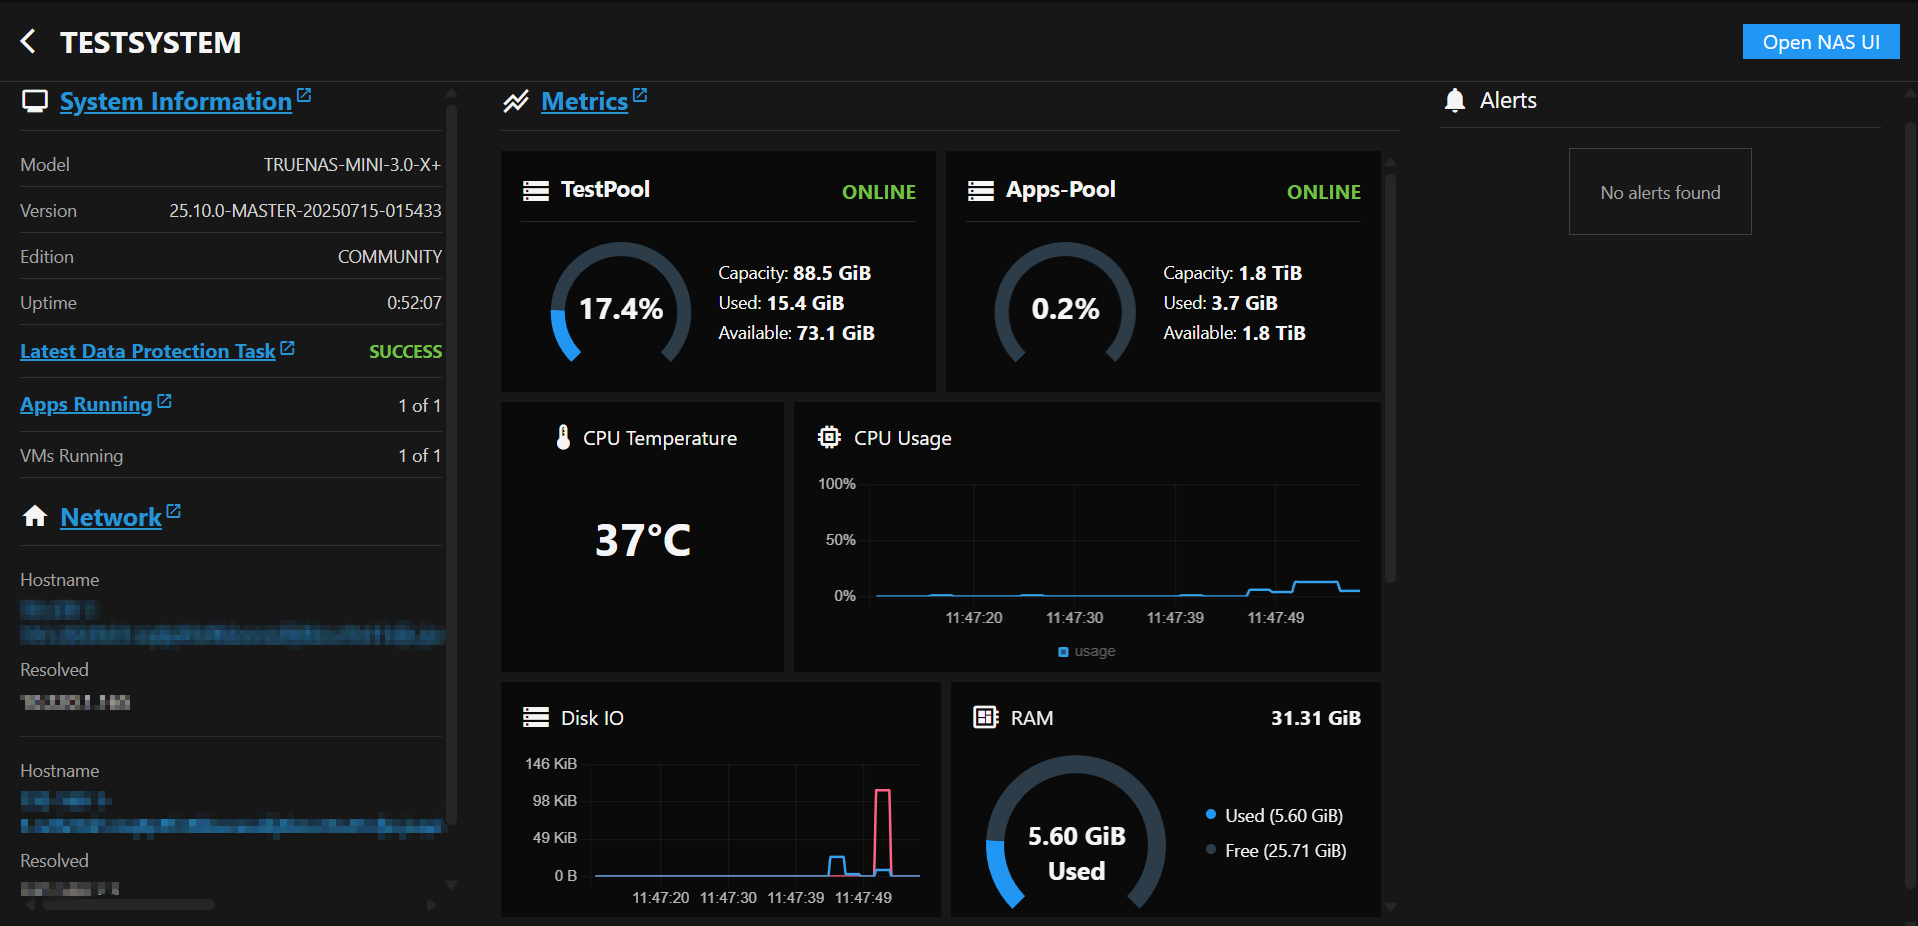
Click on the query_stats icon on a system card to go to the system info screen.
Viewing System Information
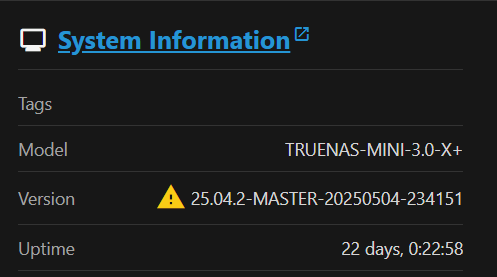
In the System Information section of the system info screen, users can find applied tags, model numbers, version numbers, and total system uptime.
Viewing Network Information
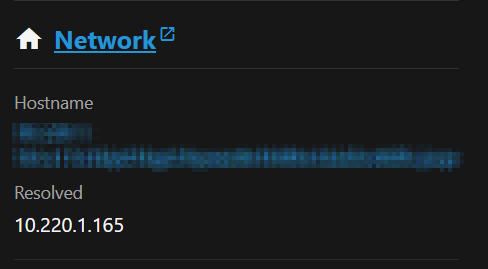
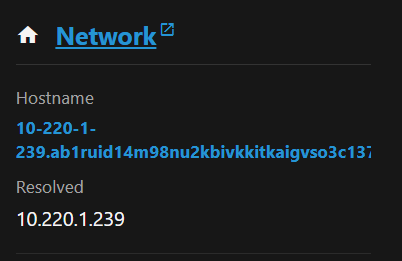
Users can also view the Network details of their TrueNAS systems from the system info screen, including the system hostname and IP address.
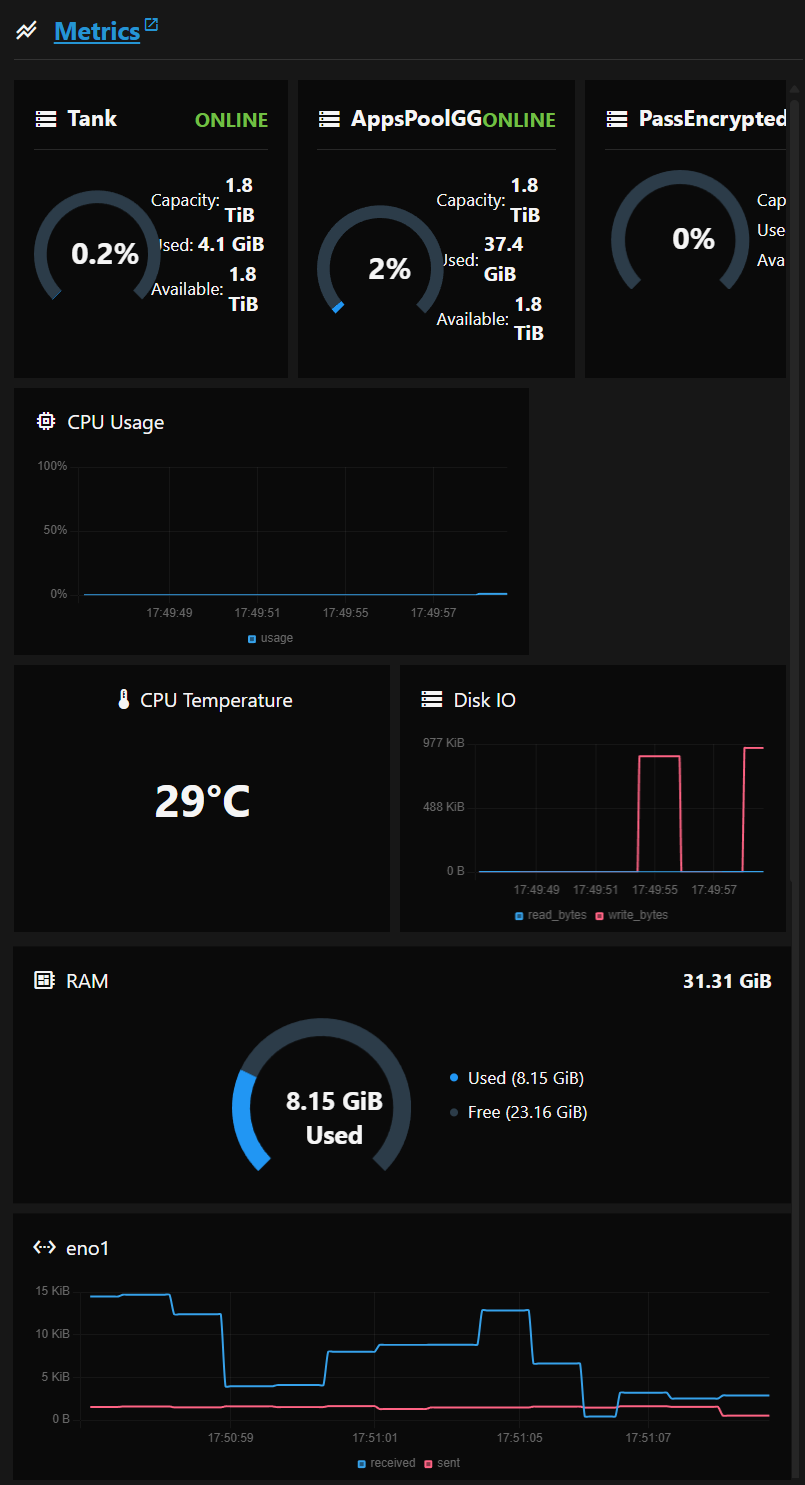
Viewing Metrics
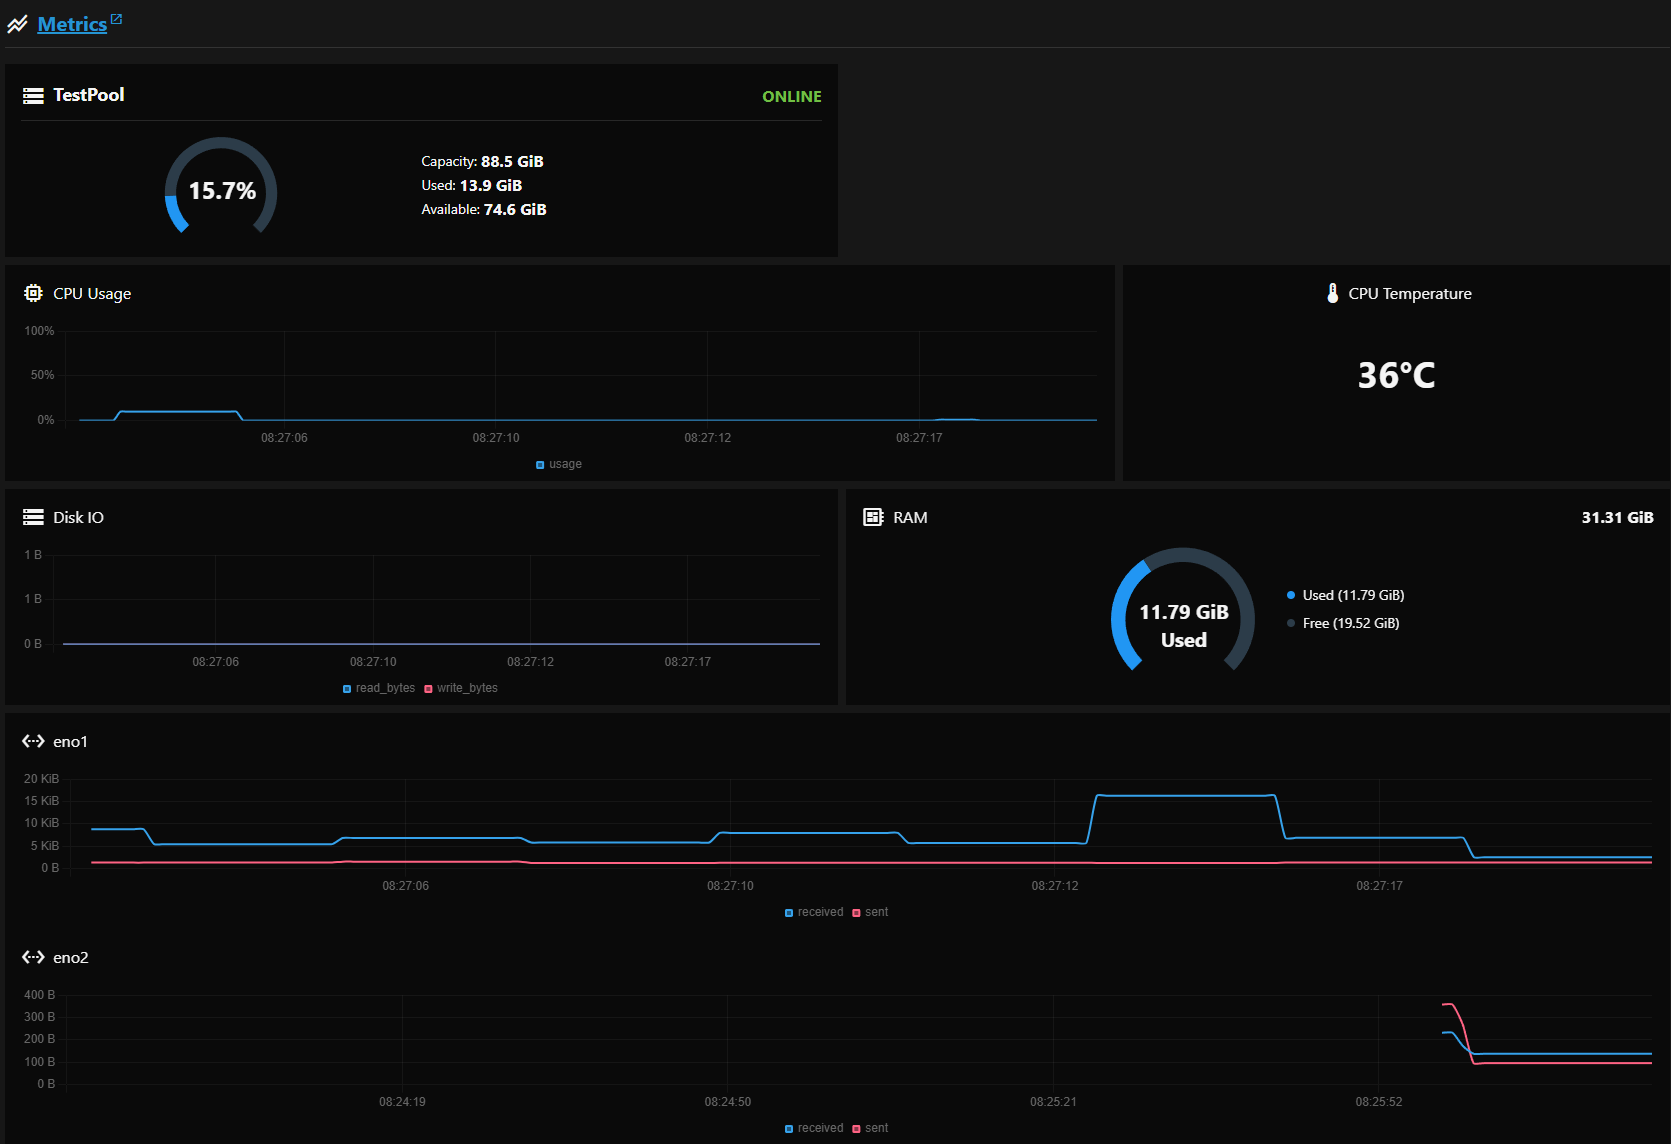
From the system info screen, users can access an expanded view of live-reporting graphs on their systems. These graphs include: memory usage, CPU usage, CPU temperature, disk I/O RAM usage, eno1 data transfer rates, and eno2 data transfer rates.
Using Notification tasks
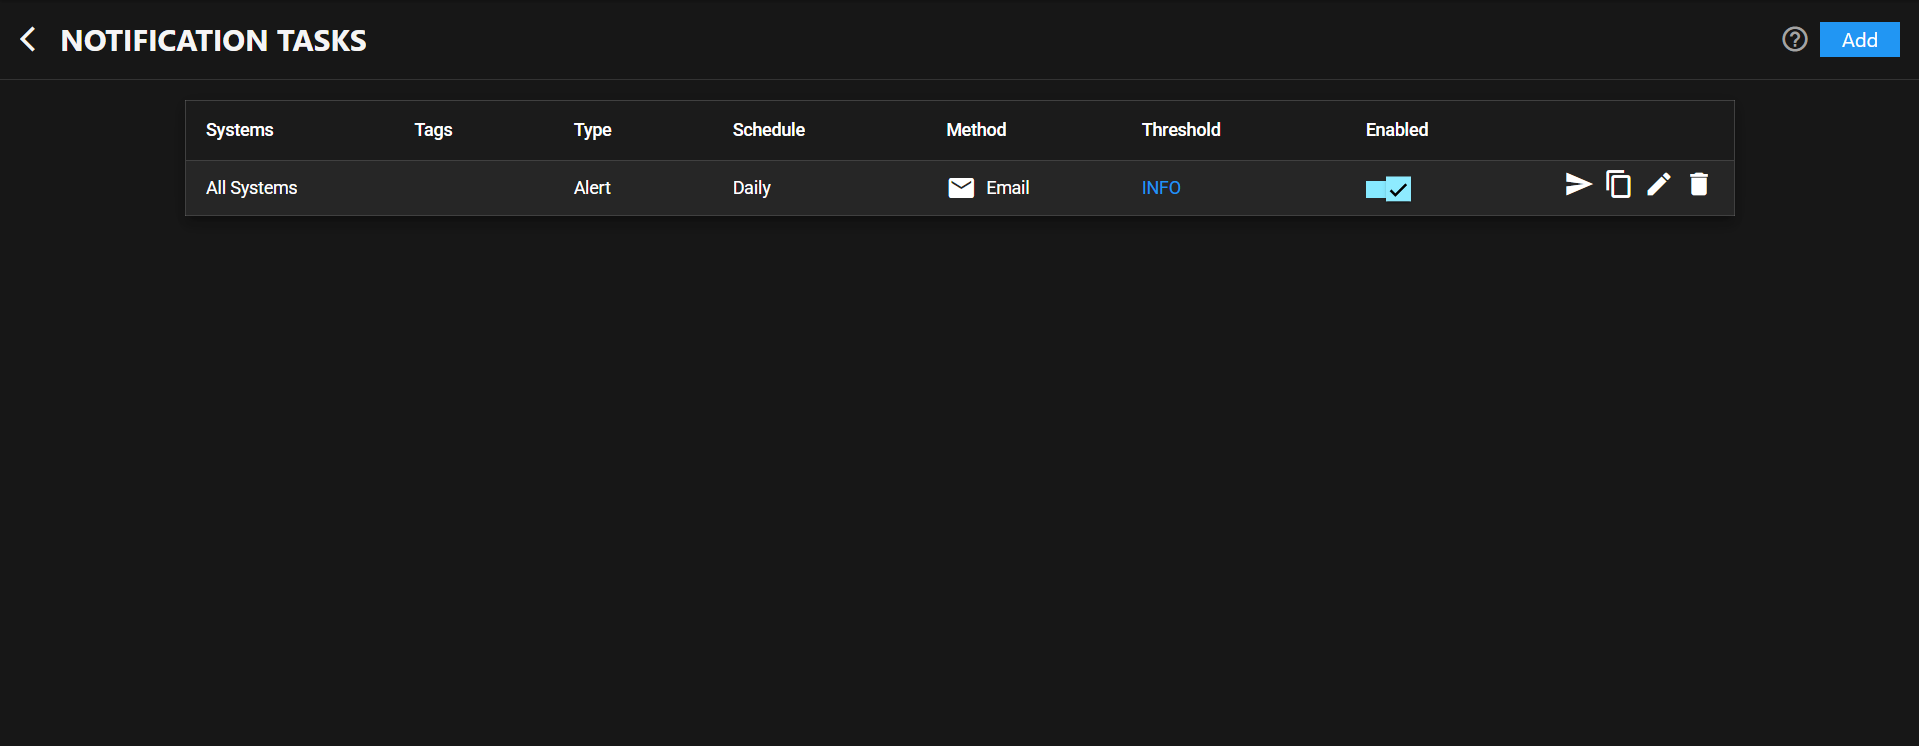
TrueNAS Connect provides automated reporting for users through the Notification Tasks screen. To open the Notification Tasks screen, click the icon in the top toolbar to open the TrueNAS Connect side menu. Click Notification Tasks.
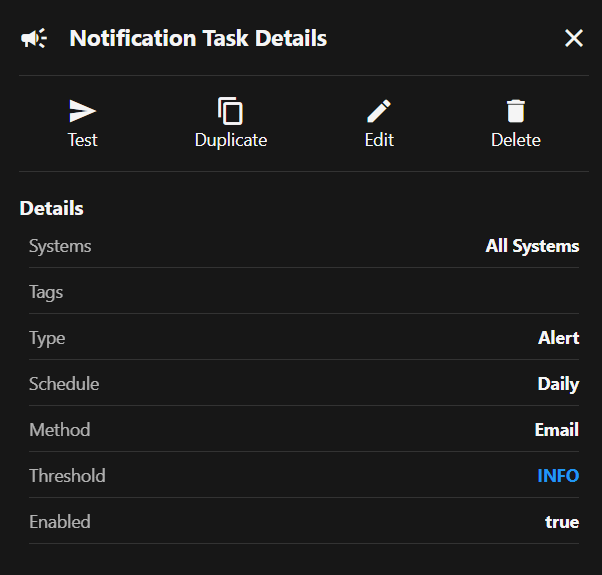
Viewing and Managing Notification Tasks
The Notification Tasks table displays all configured notification tasks.
Adding Notification Tasks
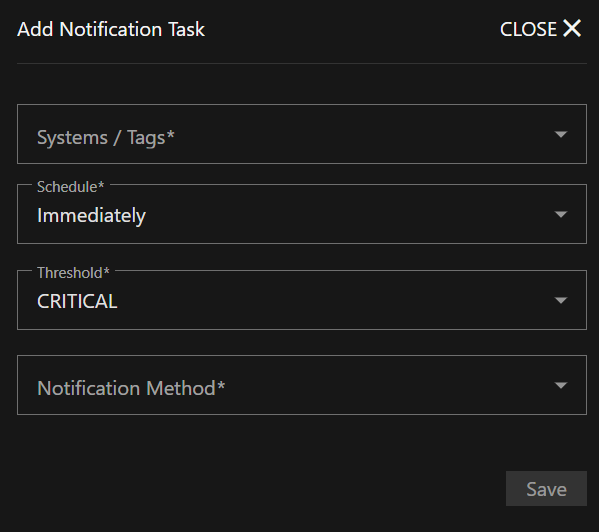
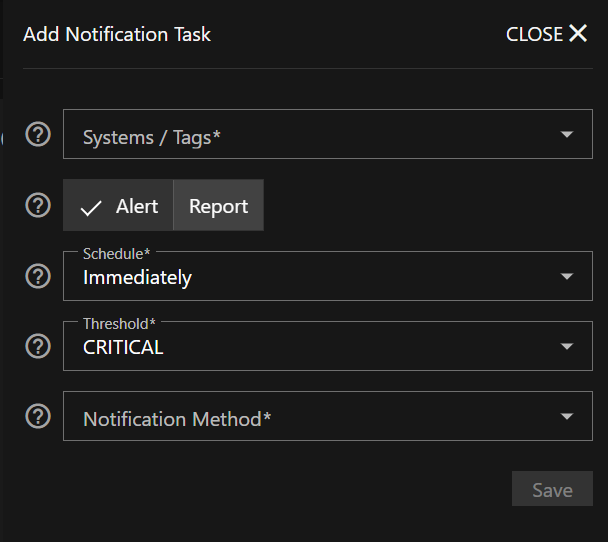
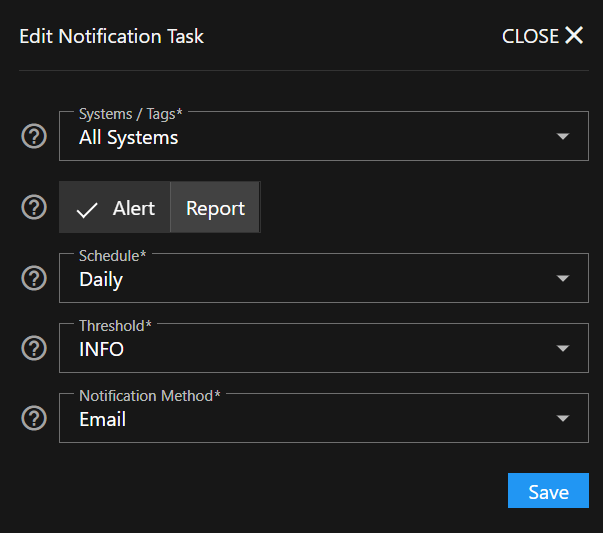
Click Add to open the Add Notification Task screen.
Notification Type
Select the type of notification to create:
- Alert - Sends notifications when alert conditions are triggered based on the threshold settings
- Report - Sends automated reports containing system performance data, storage insights, alert summaries, and predictive analysis
Schedule
Select the frequency to receive notifications for the current task.
For Alert notifications: Select Immediately to have notifications sent as soon as the alert level is triggered or select Hourly, Daily, Weekly, or Monthly to schedule periodic notifications.
For Report notifications: Select Hourly, Daily, or Weekly to schedule automated report delivery.
Threshold
Select the level of alert severity to associate with this notification task. Select CRITICAL, ERROR, WARNING, or INFO to receive notifications for all alerts at the selected level and above.
For example, a notification task set to Immediately and WARNING immediately sends notifications for all at or above the WARNING level, including ERROR and CRITICAL.
Notification Method
Select the contact type for this notification task. Options include Email, Sms text message, Slack, and Pagerduty.
Configure contact account or address details for the selected method in Notification Method Configuration.
Report Content
Automated reports include high-level data points useful for all user personas:
- Storage availability and usage - Pool-level storage metrics and usage trends since last report
- Predictive analysis - Forecasts when storage usage will exceed recommended thresholds
- Available updates - Notifications about TrueNAS system updates and application updates
- Alert history - Summary of critical, error, and warning alerts with resolution status
- Call-to-action link - Direct access to TrueNAS Connect interface for detailed analysis
Enterprise Customization
As users increase TrueNAS Connect tier status, reports become more customizable with additional Enterprise-tier metrics:
- CPU consumption (average and peak usage)
- Memory consumption (average and peak usage)
- Network throughput and roundtrip time statistics
- Storage latency data
- Replication status and duration metrics
- Dataset quota insights and snapshot counts
- TrueNAS access auditing (login activity)
- Critical VM uptime statistics
Configuring Automatic Email Reports
TrueNAS Connect provides automated email reports that deliver comprehensive system insights directly to your inbox. These reports offer peace of mind when systems operate within acceptable parameters and provide actionable information when performance or resource usage becomes abnormal.
To configure automatic email reports:
- From the Notification Tasks screen, click Add
- Select the systems you want to monitor from the Systems/Tags dropdown
- Choose Report as the notification type
- Select your preferred schedule (Hourly, Daily, or Weekly)
- Set the Threshold level for alert summaries to include in reports
- Choose Email as the Notification Method
- Click Save to create the automated report task
Understanding Report Contents
Automated email reports contain comprehensive data points designed to be informative and engaging for all user personas:
Standard Report Features
All TrueNAS Connect users receive reports containing:
Storage Insights: Pool-level availability and usage statistics
- Current storage utilization (e.g., 4TiB / 8TiB (50% used))
- Usage changes since last report (e.g., tank’s available storage decreased by 3.3%)
Predictive Analysis: Forecasting capabilities that help prevent issues before they arise
- Storage threshold predictions (e.g., tank’s used storage will exceed 80% in 3 months)
Update Notifications: System and application update availability
- TrueNAS version updates (e.g., A new stable TrueNAS version is available for Campbell Backup)
- Application security updates (e.g., The Plex app can be updated to address two CVEs)
Alert History: Comprehensive alert summaries
- Alert counts by severity level
- Resolution status for critical issues
- Historical alert trends
Call-to-Action: Direct link to TrueNAS Connect interface for detailed analysis and drill-down capabilities
Enterprise Customization Options
Enterprise-tier TrueNAS Connect users can customize their automated reports with additional metrics:
- Performance Metrics: CPU consumption (average and peak), memory usage statistics
- Network Analytics: Average throughput, peak roundtrip time data
- Storage Performance: Latency measurements and performance insights
- Replication Monitoring: Status updates, data volumes, and task duration analytics
- Resource Management: Dataset quota insights and snapshot count summaries
- Security Auditing: TrueNAS access logs showing login activity and timing
- Virtual Machine Health: Uptime statistics for critical VMs
Benefits of Automatic Email Reports
Automated reports serve multiple purposes in your TrueNAS infrastructure management:
- Proactive Monitoring: Receive predictive insights that help address issues before they impact operations
- Operational Visibility: Stay informed about fleet performance without actively monitoring individual systems
- Historical Context: Track trends and changes over time to understand system behavior patterns
- Actionable Intelligence: Get specific recommendations and alerts that require attention
- Streamlined Management: Access detailed information through convenient email delivery with direct links to the TrueNAS Connect interface for deeper analysis
Reports are designed to be engaging and informative regardless of technical expertise, with clear data presentation and actionable recommendations that motivate users to investigate further through the TrueNAS Connect interface.
2.3 - Managing the Keyring
The TrueNAS Connect keyring provides secure, encrypted storage for your TrueNAS system keys, enabling automatic authentication when accessing your systems through TrueNAS Connect.
This tutorial walks you through creating a keyring, adding systems to it, and managing your keyring.
Understanding the Keyring
TrueNAS Connect automatically creates a key when you register your system in TrueNAS Connect. The keyring encrypts and stores keys client-side using a passphrase you create. This allows TrueNAS Connect to automatically authenticate with your systems without storing your TrueNAS user credentials.
Key benefits of using a keyring:
- Automatic authentication: No need to manually enter credentials for each system
- Client-side encryption: Your keys are encrypted locally using your passphrase
- Secure storage: Your TrueNAS credentials are encrypted and only accessible with your keyring password
- Quick access: Unlock all connected systems at once with a single passphrase
Creating Your First Keyring
When you first access TrueNAS Connect, you need to create a keyring to enable automatic authentication.
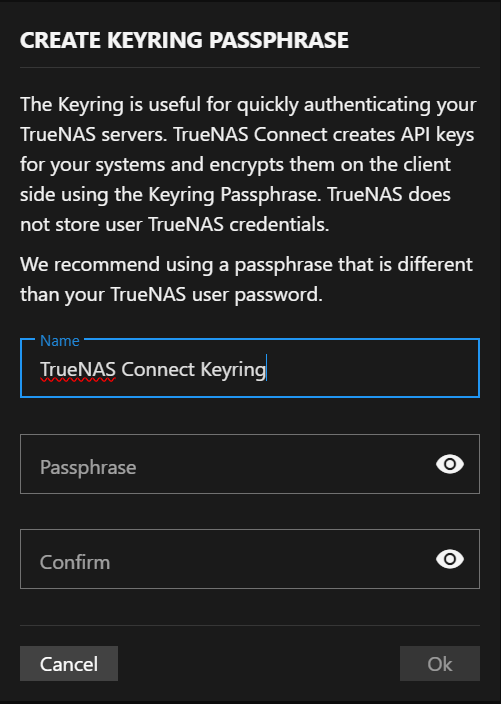
When no keyring exists, the top toolbar displays a Create Keyring button. Click this button to open the Create Keyring Passphrase dialog and begin creating your keyring.
Setting Up Your Keyring Passphrase
On the Create Keyring Passphrase dialog:
Enter a strong passphrase in Passphrase.
TrueNAS Connect recommends using a passphrase that is different from your TrueNAS user password. Strong passphrases are at least 16 characters long and include a mix of uppercase letters, lowercase letters, numbers, and special characters.
A strength indicator displays below the field showing your passphrase strength.
Re-enter your passphrase in Confirm to verify it.
Click OK to create the keyring.
The OK button remains disabled until both fields are completed and the entered passphrases match.
Adding Systems to Your Keyring
After creating your keyring, you can add your other TrueNAS systems to enable automatic authentication.
Adding During System Authentication
You can add a system to your keyring during the authentication process.
From the Dashboard, locate the system card you want to add. Enter the system authentication credentials, and then select the Add to Keyring option.
Complete the authentication process. A system key is automatically created, encrypted, and stored in your keyring.
Viewing Keyring
To see which systems are stored in your keyring:
Go to the Keyring screen. The TrueNAS Systems table, shows the system name in the TrueNAS column, Key shows Stored when an key is saved, or is blank if ones is not stored. Connected shows true for successful connections, or false for failed connections.
You can go to the TrueNAS UI My API Keys to see the TrueNAS Connect API key.
Unlocking Your Keyring
After setting up a keyring, each time you sign into TrueNAS Connect the Unlock Keyring dialog automatically opens, and prompts you to enter your passphrase to unlock the keyring.
- Enter your keyring passphrase.
- Click Ok to unlock all systems in the keyring. All systems with stored keys are automatically authenticated, and the system information cards on the dashboard populate with system data.
If you click Cancel, you need to authenticate each system individually using TrueNAS system credentials.
Managing Your Keyring
Resetting the Keyring
If you need to remove all stored keys and start over:
- Go to the Keyring screen.
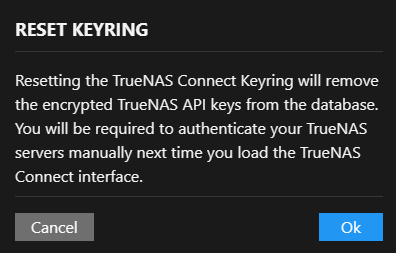
- Click the Reset button in the header.
- Review the confirmation dialog warnings.
- Click Ok to proceed with the reset, or Cancel to keep your existing keyring
After a Keyring Reset
After resetting a keyring, system included in the keyring require manual authentication the next time you sign into TrueNAS Connect. You need to re-enter system credentials for each system individually.
If you want to rebuild your keyring, create a new keyring using the Create Keyring button on the top toolbar. Remember to check Add to Keyring when re-authenticating.
Best Practices
The TrueNAS Connect keyring streamlines access to your TrueNAS systems by:
- Providing secure, encrypted storage for keys
- Enabling automatic authentication across all your systems included in the keyring
- Eliminating the need to enter individual system credentials each time you sign into TrueNAS Connect
- Maintaining security through client-side encryption
With your keyring properly configured, you can focus on managing your TrueNAS systems rather than repeatedly entering authentication credentials.
Passphrase Security
When choosing a passphrase for the keyring:
- Create a unique passphrase distinct from your TrueNAS system passwords and your OAuth account password.
- Choose a passphrase that is memorable but secure.
- Consider using a passphrase manager for complex passphrases.
Troubleshooting Authentication
If a system shows false in the Connected column, check:
- The TrueNAS system is online and accessible
- The stored key hasn’t expired or been revoked
- The network connectivity between TrueNAS Connect and your system is stable
Re-authenticate the system if needed and add it back to the keyring.
2.4 - Managing TrueNAS Systems Inventory
TrueNAS Connect provides comprehensive inventory management capabilities that allow you to view detailed hardware information, disk specifications, and system components across all connected TrueNAS systems from a centralized interface.
Why Use Inventory Management
Inventory management helps you:
- Monitor fleet health: Quickly identify systems with hardware issues or capacity constraints
- Plan upgrades: Track hardware specifications to determine which systems need updates
- Maintain compliance: Generate hardware reports for audits and asset management
- Troubleshoot efficiently: Access detailed hardware information when diagnosing problems
- Optimize resources: Understand your available storage and processing capacity across all systems
Accessing the Inventory Screen
To begin managing your system inventory:
- Open the TrueNAS Connect side menu by clicking the icon in the top toolbar.
- Click Inventory to open the inventory management screen.
The Inventory screen displays hardware information for all connected TrueNAS systems in your fleet, organized by system hostname.
Reviewing System Hardware Information
Checking Mainboard Specifications
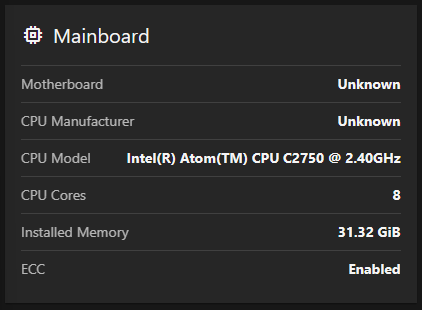
You can quickly review system hardware specifications using the Mainboard widget.
- Locate the system you want to examine by its hostname at the top of the inventory display.
- Review the Mainboard card to see essential system specifications:
- Motherboard: Model and manufacturer (shows Unknown if not detected)
- CPU Manufacturer: Processor brand (Intel, AMD, etc.)
- CPU Model: Complete processor specifications including frequency
- CPU Cores: Number of available processor cores
- Installed Memory: Total system RAM in GiB (1 GiB = 1,024 MB)
- ECC: Error-Correcting Code memory status - ECC memory automatically detects and corrects data errors (Enabled/Disabled)
Examining GPU Information
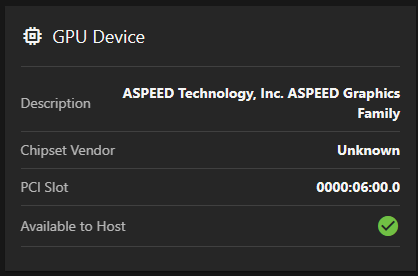
When systems include graphics hardware, check the GPU Device widget.
- Review the Description field for the complete graphics device information.
- Check Chipset Vendor for manufacturer details.
- Note the PCI Slot location - this is the physical connector where the graphics card is installed (useful for hardware troubleshooting).
- Verify Available to Host status shows a green check icon when the GPU is accessible for use.
Managing Storage Device Information
Viewing Storage Overview
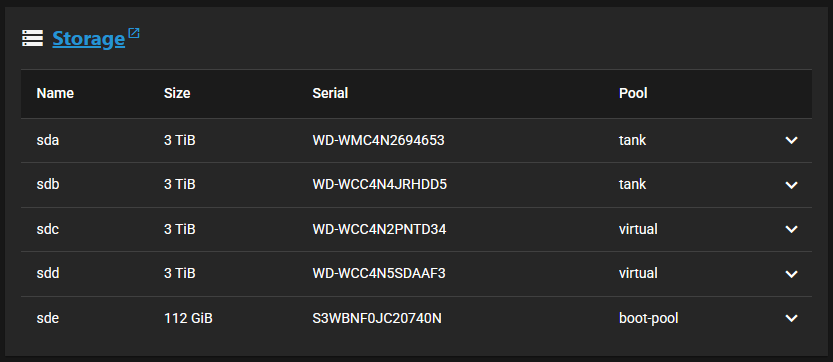
The Storage widget provides centralized disk management.
- Click the Storage title link to open the TrueNAS Storage Dashboard for direct storage management.
- Review the storage device table displaying all disks for the selected system.
Examining Individual Disk Details
To get comprehensive information about specific storage devices:
- Locate the disk you want to examine in the storage device table.
- Note the basic information displayed in the table columns:
- Name: Device identifier (sda, sdb, etc.)
- Size: Storage capacity in TiB or GiB
- Serial: Device serial number for identification
- Pool: ZFS pool assignment - ZFS pools are groups of disks that work together for data storage and protection
- Click the button in the disk’s row to open detailed device information.
For most users: The basic table information (Name, Size, Serial, Pool) provides everything needed for routine management. The detailed information below is useful for troubleshooting or advanced planning.
- Review additional disk specifications in the expanded panel (optional):
- Disk Type: HDD (traditional spinning disk) or SSD (solid state drive)
- Model: Complete device model information
- Transfer Mode: Disk transfer mode setting (typically shows Auto)
- Rotation Rate: RPM for mechanical drives (7200, 5400, etc.) - not applicable for SSDs
- HDD Standby: Power-saving feature that spins down idle drives
- Adv. Power Management: Additional power efficiency settings
- Click the button to close the device details panel.
Exporting Inventory Data
You can export inventory information for reporting, analysis, or record-keeping.
Selecting Export Options
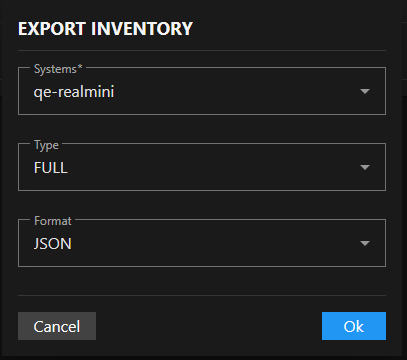
Click the Export button in the top-right corner of the inventory screen to open the Export Inventory dialog with three configuration options.
Systems Selection
Click the Systems dropdown to select which TrueNAS systems to include. Systems appear by hostname (for example, “my-system”).
Choose individual systems or select multiple systems for batch export.
Type Selection
Click the Type dropdown to select the scope of inventory data to export.
- Choose Full for complete comprehensive inventory including system info, hardware specifications, disk information with ZFS pool assignments, GPU details, and technical attributes.
- Select Systems for high-level system information only including system ID, hostname, serial number, TrueNAS version, CPU model, core count, and total memory.
- Pick Disks for storage-focused export containing disk names, models, serial numbers, capacity, type (HDD/SSD), rotation rates, and system association.
Format Selection
Click the Format dropdown to choose the file format for the exported inventory data.
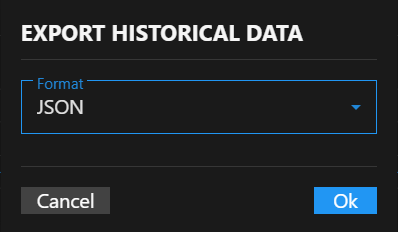
- Select JSON for structured data format suitable for programmatic processing and API integration.
- Choose CSV for comma-separated values format compatible with spreadsheet applications and data analysis tools.
Completing the Export
Review your selections to ensure you’re exporting the correct data scope and format.
Click Ok to execute the inventory export and download the resulting file. The export file downloads to your default download location with the inventory data in your selected format.
Fleet Management Best Practices
Regular Inventory Reviews
Schedule regular inventory reviews to:
- Monitor system specifications across your fleet for consistency.
- Track hardware changes and upgrades over time.
- Identify systems that may need attention or updates.
- Plan for hardware lifecycle management and replacements.
Using Export Data
Leverage exported inventory data for:
- Asset Management: Maintain accurate hardware records for compliance and budgeting.
- Capacity Planning: Analyze storage utilization and plan expansion needs.
- Maintenance Scheduling: Track drive health and schedule proactive maintenance.
- Documentation: Create hardware documentation for your organization’s systems.
Storage Device Monitoring
Use the detailed disk information to:
- Monitor disk health and performance characteristics.
- Track ZFS pool assignments and storage allocation across disk groups.
- Identify drives nearing capacity or showing signs of wear.
- Plan storage upgrades and expansions based on current utilization.
The TrueNAS Connect inventory system provides you with comprehensive visibility into your entire fleet’s hardware and storage configuration, enabling proactive management and informed decision-making for your storage infrastructure.
2.5 - Managing Virtualization
Virtual machines provide isolated computing environments that run alongside your TrueNAS system. TrueNAS Connect makes it easy to monitor and manage your virtual machines through the Applications screen.
Before You Begin
Ensure you have:
- Virtual machines configured on your TrueNAS system.
- Appropriate permissions to manage virtual machines.
- Access to the TrueNAS Connect interface.
Accessing Virtual Machine Management
To access virtual machine management:
- Navigate to Dashboard > Applications.
- Locate the Virtual Machines section on the Applications screen.
The Applications screen shows three main sections: Apps, Containers, and Virtual Machines. The Virtual Machines section displays all VMs configured on your system.
Understanding the Virtual Machines Interface
The Virtual Machines section provides a comprehensive view of your VMs.
Virtual Machine List
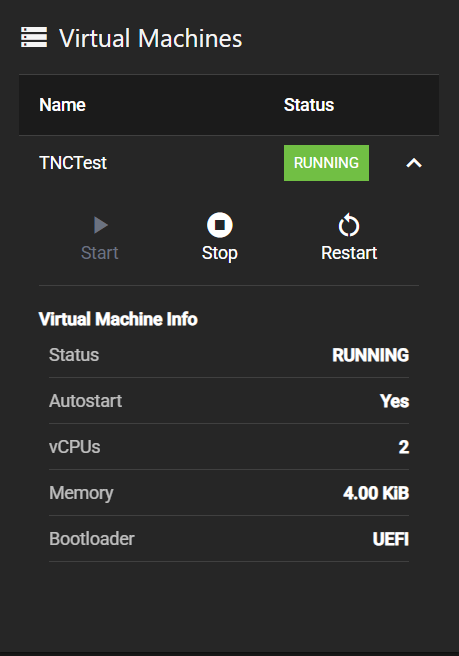
Each virtual machine appears as a row in the table with:
- Name: The VM identifier (e.g., TNCTest).
- Status: Current operational state (RUNNING, STOPPED, etc.).
- Expand button: Click to access detailed information and controls.
Expanding Virtual Machine Details
Click the expand button (down arrow) next to any virtual machine to reveal control buttons and virtual machine information.
Control Buttons
Three primary action buttons appear at the top:
- Start: Powers on a stopped virtual machine.
- Stop: Gracefully shuts down a running virtual machine.
- Restart: Reboots the virtual machine.
Note: The Start button appears disabled when a VM is already running. Only available actions are enabled based on the current VM state.
Virtual Machine Information
The expanded view displays key VM specifications:
- Status: Current operational state.
- Autostart: Whether the VM starts automatically with the system.
- vCPUs: Number of virtual CPU cores allocated.
- Memory: Amount of RAM assigned to the VM.
- Bootloader: Boot method (UEFI, BIOS, etc.).
Managing Virtual Machine Operations
Starting a Virtual Machine
To start a stopped virtual machine:
- Navigate to the Applications screen.
- Locate your virtual machine in the Virtual Machines section.
- Click the expand button to show VM details.
- Click Start.
The VM begins the boot process and the status updates to RUNNING.
Stopping a Virtual Machine
To stop a running virtual machine:
Navigate to the Applications screen.
Locate your virtual machine in the Virtual Machines section.
Click the expand button to show VM details.
Click Stop.
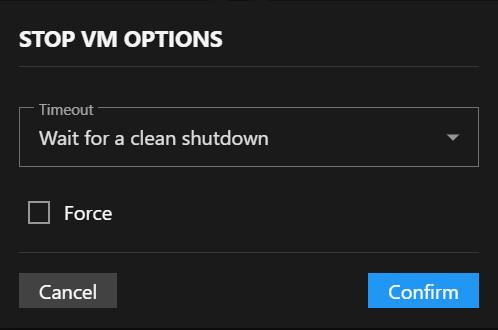
This opens the STOP VM OPTIONS dialog with configuration choices:
Stop Options
Timeout: Choose how long to wait for graceful shutdown:
- Wait for a clean shutdown (default).
- Wait for 30 seconds.
- Wait for 1 minute.
- Wait for 5 minutes.
Force: Check this option to force stop the VM if it does not shut down within the timeout period.
Warning: Using the Force option may cause data loss if the VM has unsaved work. Always try a clean shutdown first.
- Configure your preferred timeout and force options.
- Click Confirm to stop the VM.
Restarting a Virtual Machine
To restart a running virtual machine:
Navigate to the Applications screen.
Locate your virtual machine in the Virtual Machines section.
Click the expand button to show VM details.
Click Restart.
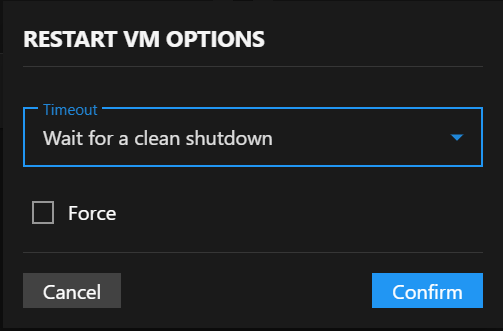
This opens the RESTART VM OPTIONS dialog with the same configuration options as stopping:
Restart Options
Timeout: Select shutdown timeout period before restart:
- Wait for a clean shutdown (default).
- Wait for 30 seconds.
- Wait for 1 minute.
- Wait for 5 minutes.
Force: Enable to force restart if clean shutdown fails within the timeout.
- Configure your restart preferences.
- Click Confirm to restart the VM.
The VM shuts down gracefully (or forcefully if specified) and then automatically starts up again.
Monitoring Virtual Machine Status
Status Indicators
Virtual machines display status information in multiple locations:
- Main table: Shows current status (RUNNING, STOPPED, etc.).
- Expanded details: Provides additional status information.
- Status badges: Use color coding for quick identification.
Real-time Updates
The interface automatically updates to reflect:
- Status changes during start/stop operations.
- Resource usage updates.
- Configuration changes.
Using the Mobile and Responsive Interface
On mobile devices, the virtual machine interface adapts:
- Simplified view: Shows VM name and status in a compact format.
- Touch controls: Tap to expand and access detailed information.
- Slide panels: VM details open in slide-out panels for better mobile navigation.
Taking The Next Steps
After learning to manage virtual machines, consider exploring:
- Health Reporting to monitor VM performance and system health.
- Managing TrueNAS Systems Inventory to track VM hardware specifications.
- Managing the Keyring for secure API key storage and authentication.
Troubleshooting
Virtual Machine Does Not Start
- Verify the VM configuration in TrueNAS.
- Check available system resources (CPU, memory).
- Review TrueNAS logs for startup errors.
Virtual Machine Does Not Stop
- Try increasing the timeout period in stop options.
- Use the Force option if a clean shutdown fails.
- Check if the VM has active connections preventing shutdown.
Status Does Not Update
- Refresh the Applications screen.
- Verify network connectivity to your TrueNAS system.
- Check TrueNAS system status.
2.6 - TrueNAS Web Install
TrueNAS Connect allows you to install TrueNAS (version 25.10 or later) on your system using the web-based installation feature through your browser. This process works well for most users whose systems have USB as the priority boot choice, even when the system does not have IPMI access or VGA ports available.
The streamlined installation automatically handles authentication and configuration setup without requiring a keyboard, mouse, or display connected to the target system.
Prerequisites
Before beginning the remote installation:
Prepare the Installation Media
- Get the latest TrueNAS SCALE ISO file from the TrueNAS website.
- Flash the TrueNAS ISO to a USB drive. For detailed instructions, see Preparing the Install File
The target system must boot from USB by default. Consumer-grade NAS systems typically have USB as the priority boot choice. If your system does not boot from USB automatically, a TrueNAS Connect remote install is not possible.
Verify Network Requirements
- Both your client (accessing TrueNAS Connect) and the target system must be on the same local network segment.
- The target system must be able to reach your TrueNAS Connect client over the local network.
- The target system must have Multicast DNS capability for automatic discovery.
The web installation process and initial system configuration require local network access. TrueNAS Connect uses a secure architecture in which all installation commands flow directly from your browser to the target system over your local network. TrueNAS Connect servers only provide authentication—they never handle system management commands.
Setting Up the Target System
- Place the TrueNAS installation USB drive into the target system.
- Boot up or restart the target system - it should automatically boot from the USB drive if USB is configured as the priority boot choice.
- Allow time for system detection. The TrueNAS installer starts and makes the system discoverable by TrueNAS Connect. Allow time for the system to complete initial startup. TrueNAS Connect automatically detects the system when it is ready.
Accessing the Remote Installation Feature
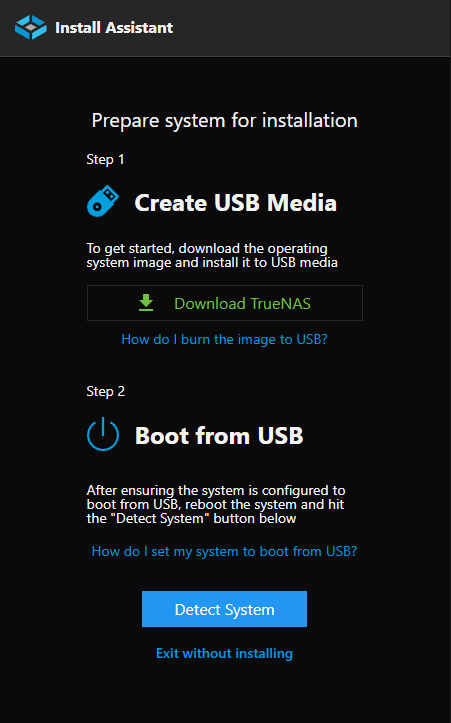
From the TrueNAS Connect dashboard, click Install Assistant to initiate remote installations for detected systems.
Connecting the System
Using Install Assistant Features
The Install Assistant provides a direct link to download the latest TrueNAS ISO (must be version 25.10 or later), a link to “How do I burn the image to USB?” with Rufus instructions for creating bootable USB media, and information about USB boot configuration requirements.
Initiating the Remote Installation Process
After you have created the bootable USB drive and powered on the target system, continue with the detection process:
After inserting the USB drive into the target system and powering it on, click the Detect System button in TrueNAS Connect. This opens an Add System pop-up with entry fields for system name, TrueNAS version and model.
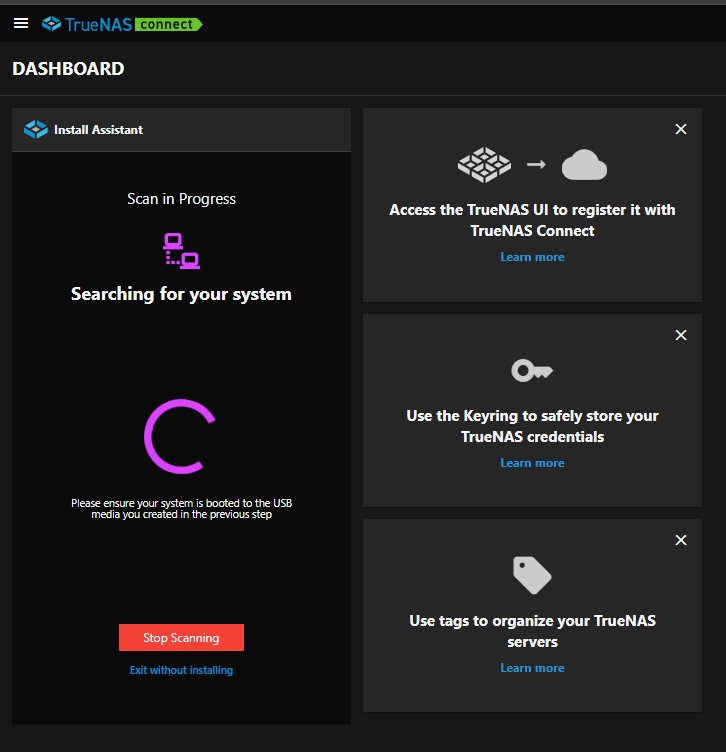
After entering this information, the Install Assistant displays Scan in Progress and begins searching for your system on the network.
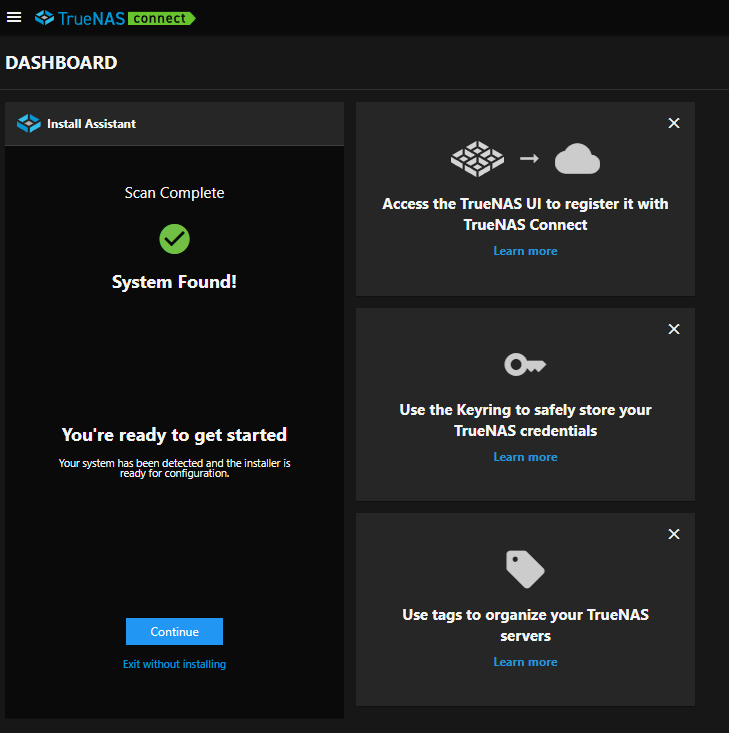
If successful, the Install Assistant displays System found and a Continue button appears to proceed with the installation.
TrueNAS Connect establishes a secure connection with the installer through automatic certificate generation and host name assignment.
The system provides high-level status updates throughout the installation process:
- “We have established communication with your NAS.”
- “We are now installing TrueNAS Community Edition to [drive identifier].”
- “Installation complete, rebooting and reconnecting to TrueNAS Connect.”
After installation completes, the installer saves the authentication token and certificate to the TrueNAS system for future automatic connection to TrueNAS Connect.
Completing System Registration
The registration process connects your target system to your TrueNAS Connect account.
Completing the Registration Form
Complete the registration form with your system details. The installer token passes automatically through the registration process, so you do not need to enter tokens manually.
System Information
Provide the required system details, including host name, location, and any relevant tags for organization.
Submit Registration
Click submit to proceed with the registration. The system processes your registration and generates SSL certificates automatically.
Using the Installation Wizard
After successful registration and certificate generation, TrueNAS Connect displays your system dashboard and launches the installation wizard.
Completing Installation
The installation wizard guides you through the following steps:
System Settings:
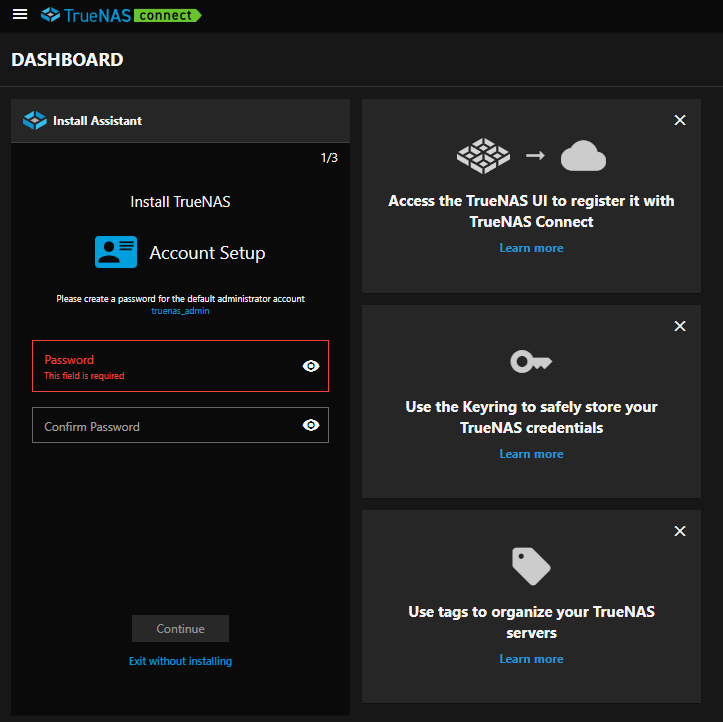
- Setup truenas_admin credentials: Configure the administrative user account credentials.
Storage Configuration:
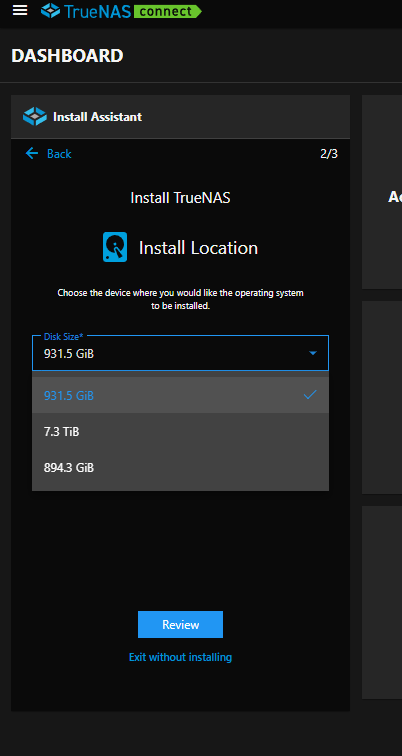
- Select the installation target from the available disks by size.
- Choose an appropriate disk and confirm the data erasure warning.
Note: The remote install process assumes new hardware, so no existing data is presumed to exist on the system disks. Previous disk information, indicating which disk previously held the system configuration, does not appear.
- Mirror Installation: If the system detects multiple disks of the same size, you see additional options:
- Mirror my TrueNAS installation for extra protection checkbox. or the warning:
- We detected a TrueNAS installation on another drive. This can cause problems during the installation process.
Review and Install:
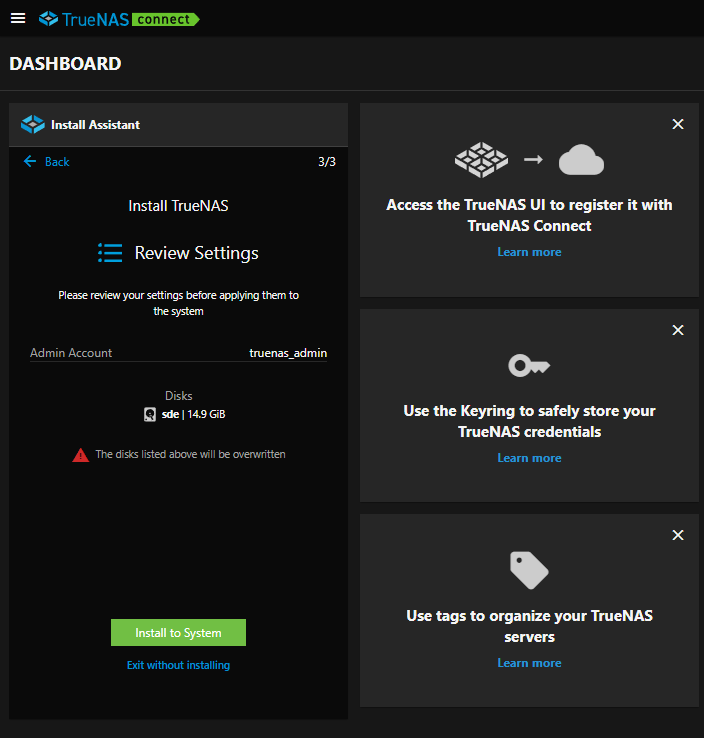
- Click the Review button to review your configuration settings.
- Click Install to System to begin the installation process.
- Monitor installation progress until you see the “Installation Complete” screen.
Post-Installation Steps:
- Select the “I have removed the USB media” checkbox when prompted.
- Confirm reboot to restart the system.
- The installer disappears temporarily from the TrueNAS Connect dashboard.
- The system returns to the dashboard showing “Connecting” status until TrueNAS is fully operational.
- The installed TrueNAS system automatically reconnects to TrueNAS Connect using the saved credentials.
After the system completes its first boot, it appears in your TrueNAS Connect dashboard and becomes available for secure management.
Configuring SSL Certificates
Important: Once the system is operational, you must manually configure the GUI SSL certificate:
- Navigate to the system IP address.
- Update the GUI SSL certificate away from the default truenas_default certificate.
- Select the certificate with the alphanumeric character sequence instead.
- Refresh the TrueNAS Connect dashboard after configuration.
Note: The software should handle this SSL certificate configuration automatically, but currently does not work. The development team has submitted a defect for this issue.
Accessing the System
After completing the SSL certificate configuration:
- Refresh the TrueNAS Connect dashboard.
- Confirm you can access the system by clicking Open TrueNAS UI from TrueNAS Connect.
Your system is now ready for configuration and management through both TrueNAS Connect and the direct TrueNAS interface.
3 - How-To
3.1 - Add Notification Tasks
Adding Notification Tasks
Click Add to open the Add Notification Task screen.
Notification Type
Select the type of notification to create:
- Alert - Sends notifications when alert conditions are triggered based on the threshold settings
- Report - Sends automated reports containing system performance data, storage insights, alert summaries, and predictive analysis
Schedule
Select the frequency to receive notifications for the current task.
For Alert notifications: Select Immediately to have notifications sent as soon as the alert level is triggered or select Hourly, Daily, Weekly, or Monthly to schedule periodic notifications.
For Report notifications: Select Hourly, Daily, or Weekly to schedule automated report delivery.
Threshold
Select the level of alert severity to associate with this notification task. Select CRITICAL, ERROR, WARNING, or INFO to receive notifications for all alerts at the selected level and above.
For example, a notification task set to Immediately and WARNING immediately sends notifications for all at or above the WARNING level, including ERROR and CRITICAL.
Notification Method
Select the contact type for this notification task. Options include Email, Sms text message, Slack, and Pagerduty.
Configure contact account or address details for the selected method in Notification Method Configuration.
Report Content
Automated reports include high-level data points useful for all user personas:
- Storage availability and usage - Pool-level storage metrics and usage trends since last report
- Predictive analysis - Forecasts when storage usage will exceed recommended thresholds
- Available updates - Notifications about TrueNAS system updates and application updates
- Alert history - Summary of critical, error, and warning alerts with resolution status
- Call-to-action link - Direct access to TrueNAS Connect interface for detailed analysis
Enterprise Customization
As users increase TrueNAS Connect tier status, reports become more customizable with additional Enterprise-tier metrics:
- CPU consumption (average and peak usage)
- Memory consumption (average and peak usage)
- Network throughput and roundtrip time statistics
- Storage latency data
- Replication status and duration metrics
- Dataset quota insights and snapshot counts
- TrueNAS access auditing (login activity)
- Critical VM uptime statistics
3.2 - Customize Your Account
Customizing Your Profile and Avatar
You can customize your TrueNAS Connect account profile by viewing your account information and setting a custom avatar image.
To access your profile settings, click the Profile option in the main navigation menu.
Viewing Profile Information
Your profile displays your account information including your email address, first name, and last name.
Profile information fields (Email Address, First Name, and Last Name) are read-only and display the information from your account used to authenticate with TrueNAS Connect.
Setting Your Avatar
You can personalize your TrueNAS Connect account by uploading a custom avatar image.
To upload an avatar:
- In the Avatar section, click Choose Avatar
- Select an image file from your computer (JPG, PNG, or WebP format)
- Click Save to apply your new avatar
Your avatar image appears throughout TrueNAS Connect, including in the main navigation and system cards.
If you want to remove your current avatar, click the button to return to the default profile icon.
3.3 - Export Inventory Data
You can export inventory information for reporting, analysis, or record-keeping.
Selecting Export Options
Click the Export button in the top-right corner of the inventory screen to open the Export Inventory dialog with three configuration options.
Systems Selection
Click the Systems dropdown to select which TrueNAS systems to include. Systems appear by hostname (for example, “my-system”).
Choose individual systems or select multiple systems for batch export.
Type Selection
Click the Type dropdown to select the scope of inventory data to export.
- Choose Full for complete comprehensive inventory including system info, hardware specifications, disk information with ZFS pool assignments, GPU details, and technical attributes.
- Select Systems for high-level system information only including system ID, hostname, serial number, TrueNAS version, CPU model, core count, and total memory.
- Pick Disks for storage-focused export containing disk names, models, serial numbers, capacity, type (HDD/SSD), rotation rates, and system association.
Format Selection
Click the Format dropdown to choose the file format for the exported inventory data.
- Select JSON for structured data format suitable for programmatic processing and API integration.
- Choose CSV for comma-separated values format compatible with spreadsheet applications and data analysis tools.
Completing the Export
Review your selections to ensure you’re exporting the correct data scope and format.
Click Ok to execute the inventory export and download the resulting file. The export file downloads to your default download location with the inventory data in your selected format.
3.4 - Report Bugs and Provide Feedback
Reporting Bugs and Providing Feedback
TrueNAS Connect is actively evolving, and your input helps shape its development. Whether you have found a bug, have a feature request, or want to share general feedback, we want to hear from you.
Accessing the Service Desk
To submit bug reports or feedback:
- Click the Feedback and Support icon button in the top toolbar.
- Click the Support Portal link in the pop-up window.
This opens the TrueNAS Connect Service Desk where you can submit your report or feedback.
Using the Service Desk
The service desk provides two options for submissions:
Report a Bug
Select Report a Bug to report issues, unexpected behavior, or errors you encounter in TrueNAS Connect.
When reporting a bug, you can provide:
- Summary - Brief description of the issue
- Description - Detailed explanation of the problem and steps to reproduce it
- Labels - Tags to categorize your bug report
- Frequency - How often the issue occurs
- Priority - Severity level of the issue
Request an Improvement
Select Request an Improvement to suggest new features, enhancements to existing functionality, or usability improvements.
When requesting an improvement, you can provide:
- Summary - Brief description of your suggestion
- Description - Detailed explanation of the improvement and its benefits
- Labels - Tags to categorize your improvement request
What to Report
We welcome all types of feedback and reports. No feedback is too small—even minor observations can help improve TrueNAS Connect for all users.
Bug Reporting vs. Technical Support
The service desk is for bug reports and product feedback, not for technical support requests.
- Use the service desk for: Reporting bugs, requesting features, or providing feedback about TrueNAS Connect
- For technical support: Contact TrueNAS Support if you need help configuring your TrueNAS systems, troubleshooting issues, or have questions about TrueNAS functionality
Future Support Options
TrueNAS Connect business tiers releasing in 2026 can include basic support from TrueNAS support teams. This provides additional assistance channels for business users beyond the service desk portal.
3.5 - Use Enclosure Maps
TrueNAS Connect provides enclosure mapping functionality that lets you visualize your storage hardware in a way that reflects your physical system layout. This feature helps you understand the relationship between your drives, pools, and the actual hardware enclosures.
Accessing Enclosure Mapping
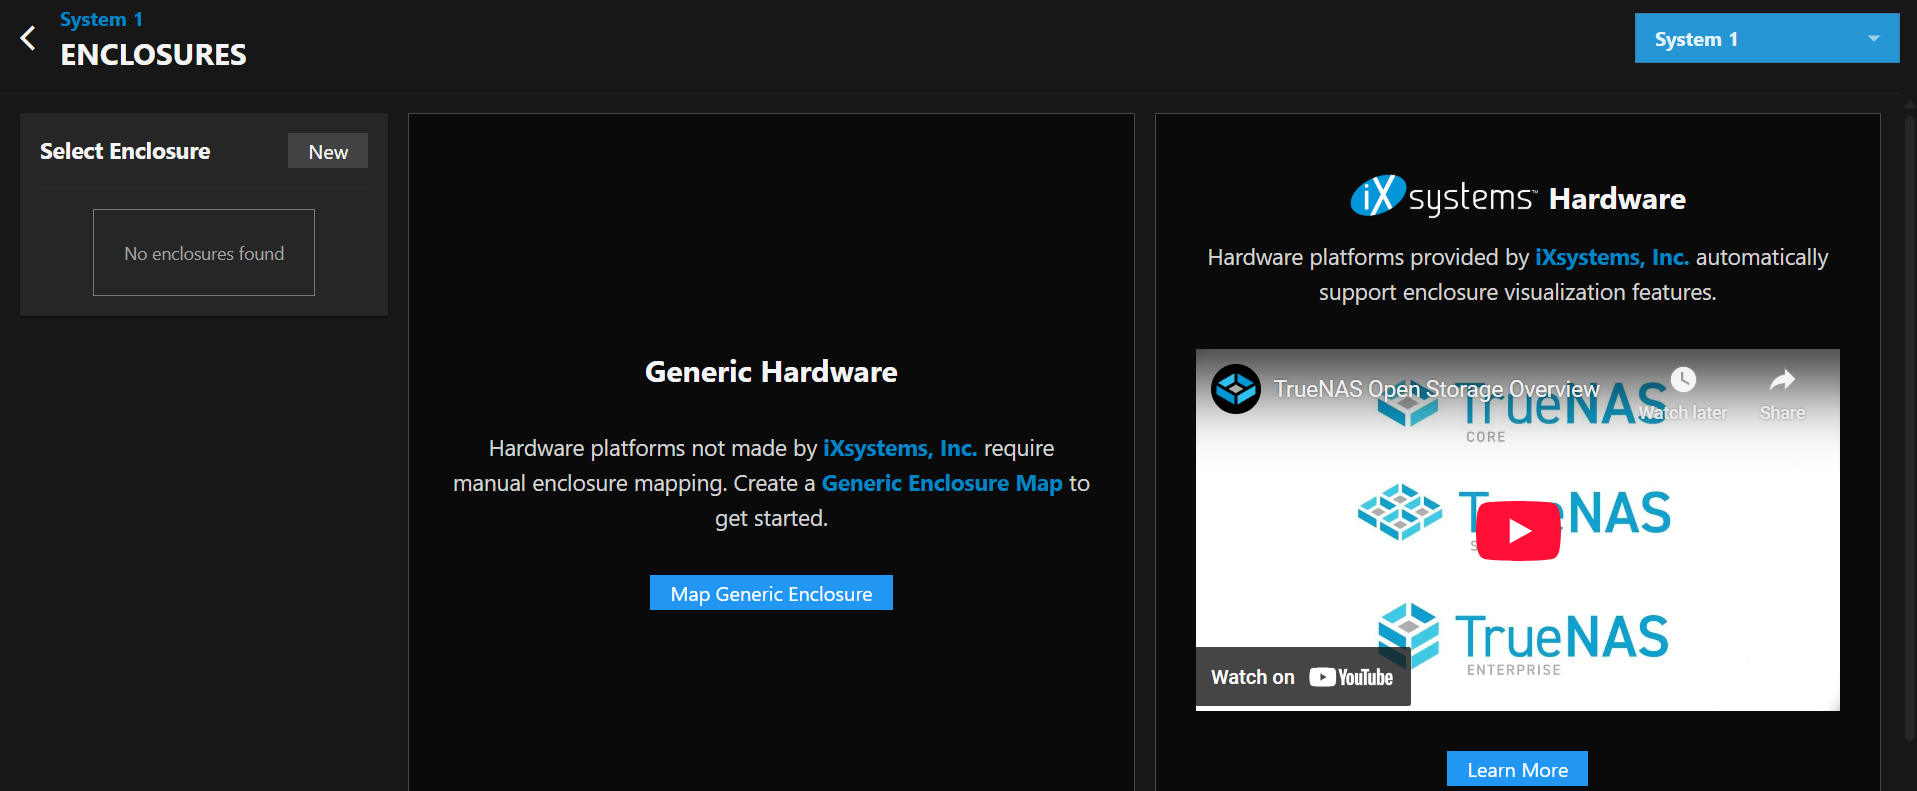
Navigate to the Enclosures screen from the main TrueNAS Connect interface to access enclosure mapping features.
Use the System dropdown menu to choose which TrueNAS system you want to view enclosure information for.
Viewing Existing Enclosures
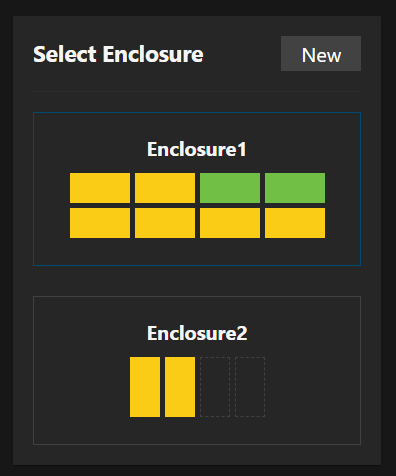
The Select Enclosure panel displays all configured enclosures for your selected system with visual previews showing slot layouts and disk status.
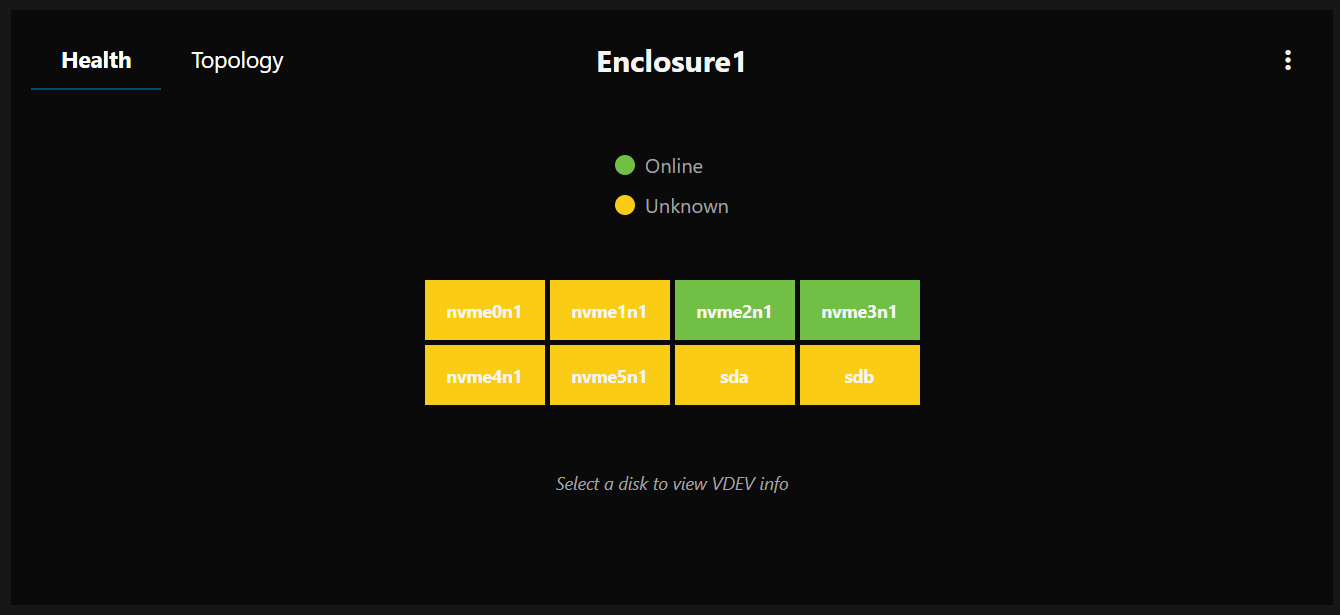
Click on any enclosure from the list to view its detailed information in the main panel. This shows a visual grid representation of all disk slots with color-coded indicators for drive health and pool membership.
Understanding Enclosure Views
- Health view displays disk health status with color-coded indicators showing online (green), unknown (yellow), and empty (dashed outline) states.
- Topology view shows storage pool relationships with colored dots matching drives to their assigned pools.
Use the health legend and topology legend to interpret the visual indicators and understand the current state of your system.
Mapping a New Enclosure
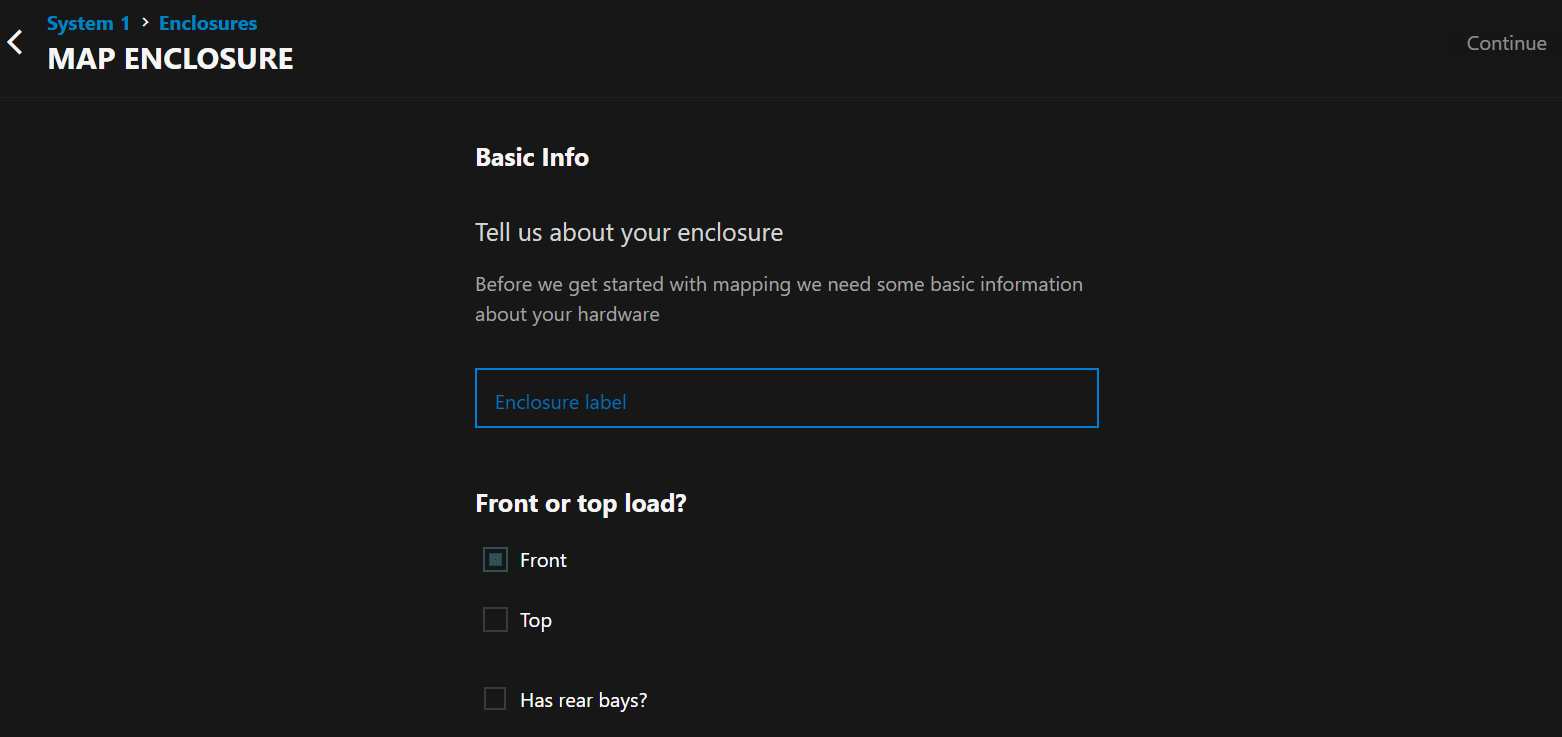
Click the New button in the Select Enclosure panel to begin mapping a new enclosure configuration.
Step 1: Configure Enclosure Details
Enter a descriptive Enclosure Label to identify your hardware.
Select the physical orientation using Front or top load? options:
- Choose Front for enclosures where disks are accessible from the front panel (most common)
- Choose Top for enclosures where disks are accessible from the top
Enable Has rear bays? if your enclosure includes additional disk slots accessible from the rear.
Click Continue to proceed to layout configuration.
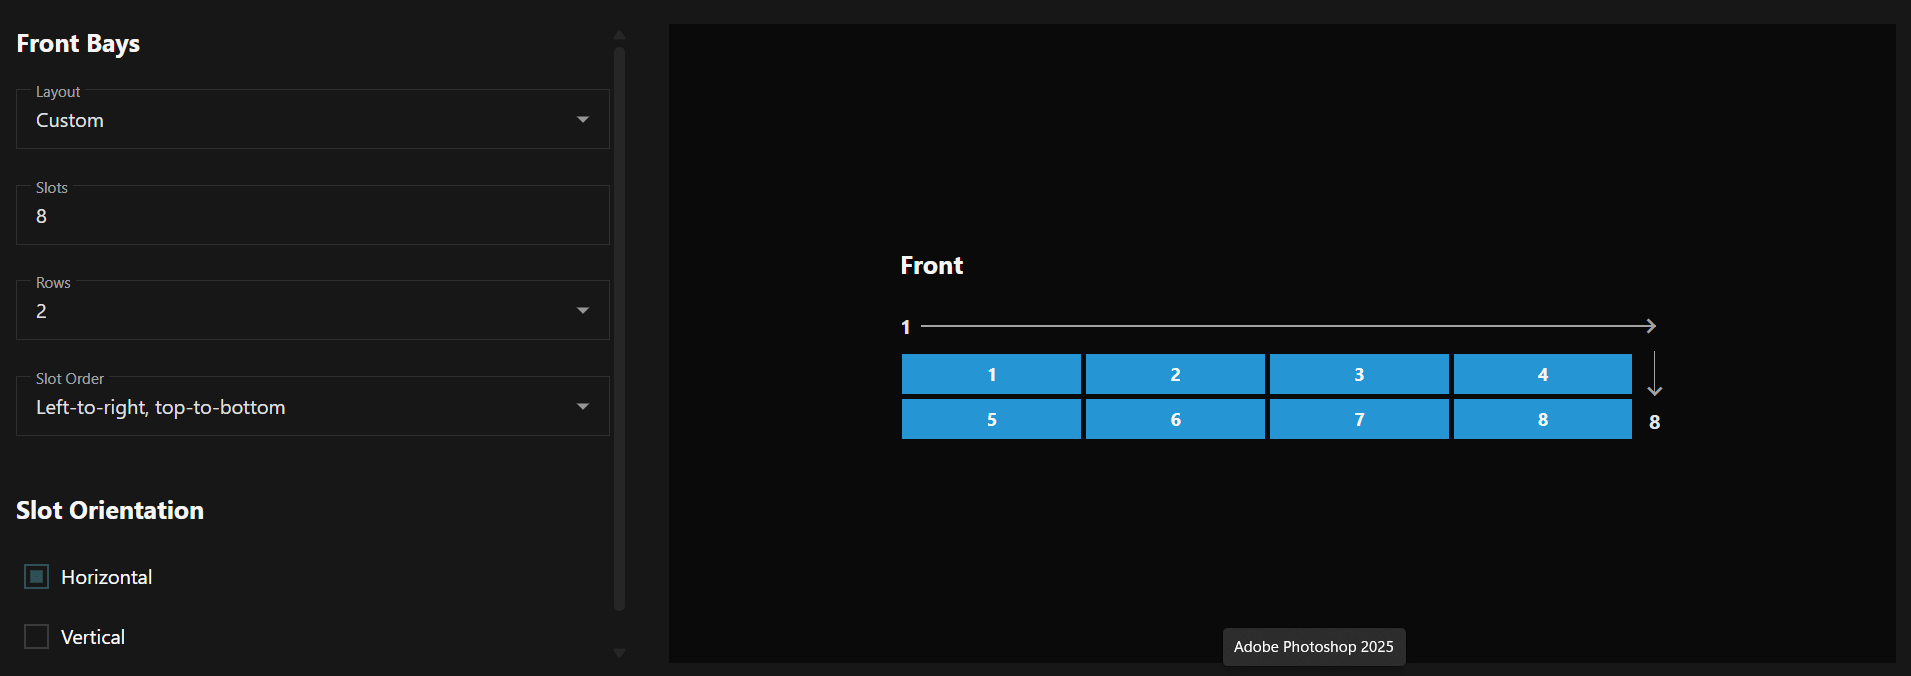
Step 2: Define Enclosure Layout
Choose a Layout preset from the dropdown for common enclosure configurations, or create a custom configuration.
Set the total number of Slots available in your enclosure.
Select the number of Rows for horizontal slot arrangement.
Choose the Slot Order pattern that matches the physical numbering sequence of your enclosure.
Define Slot Orientation as either Horizontal (most common) or Vertical based on how disks are physically inserted.
The enclosure preview updates in real-time as you modify configuration options, allowing you to verify the layout matches your physical hardware.
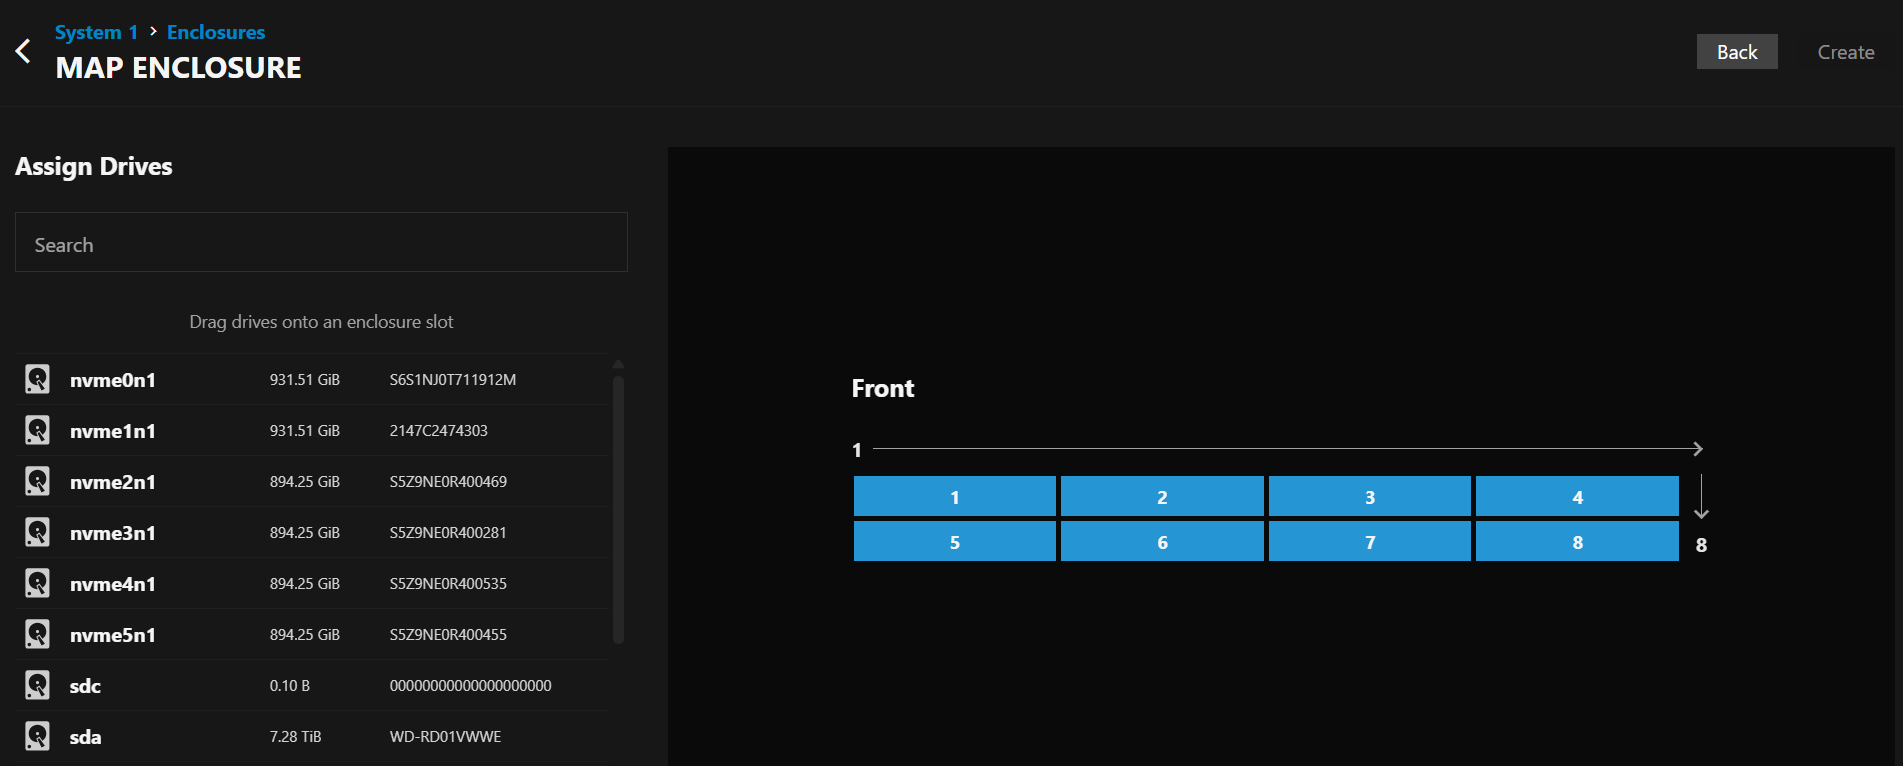
Step 3: Assign Drives
Use the Search field to filter available drives by name or serial number for easier selection.
Drag and drop drives from the Drive List into the appropriate slots in the enclosure preview.
The preview shows real-time updates as you assign drives to slots, helping you match your virtual configuration to your physical hardware layout.
Managing Enclosure Information
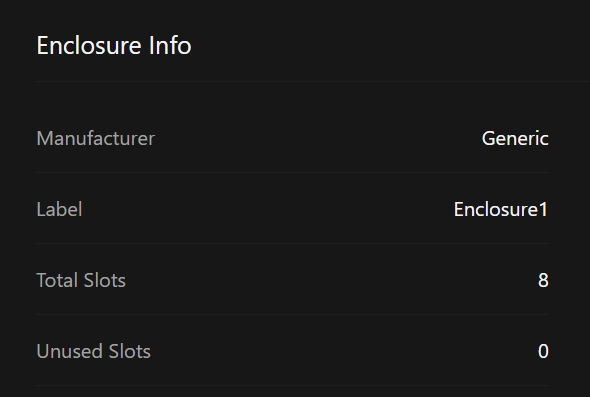
View detailed specifications in the Enclosure Info panel including manufacturer, label, total slots, and unused slots available for expansion.
Click on individual slots in the enclosure view to access detailed disk information and management options for populated slots.
Benefits of Enclosure Mapping
Enclosure mapping provides several advantages for managing your TrueNAS storage:
- Visual Hardware Representation: See your storage layout as it physically exists in your enclosures
- Simplified Troubleshooting: Quickly identify the physical location of drives experiencing issues
- Pool Visualization: Understand how your storage pools are distributed across physical hardware
- Expansion Planning: Identify available slots for future storage expansion
- Drive Management: Easily locate and manage specific drives within your physical enclosures
4 - Reference
4.1 - Access Screen
Access Screen
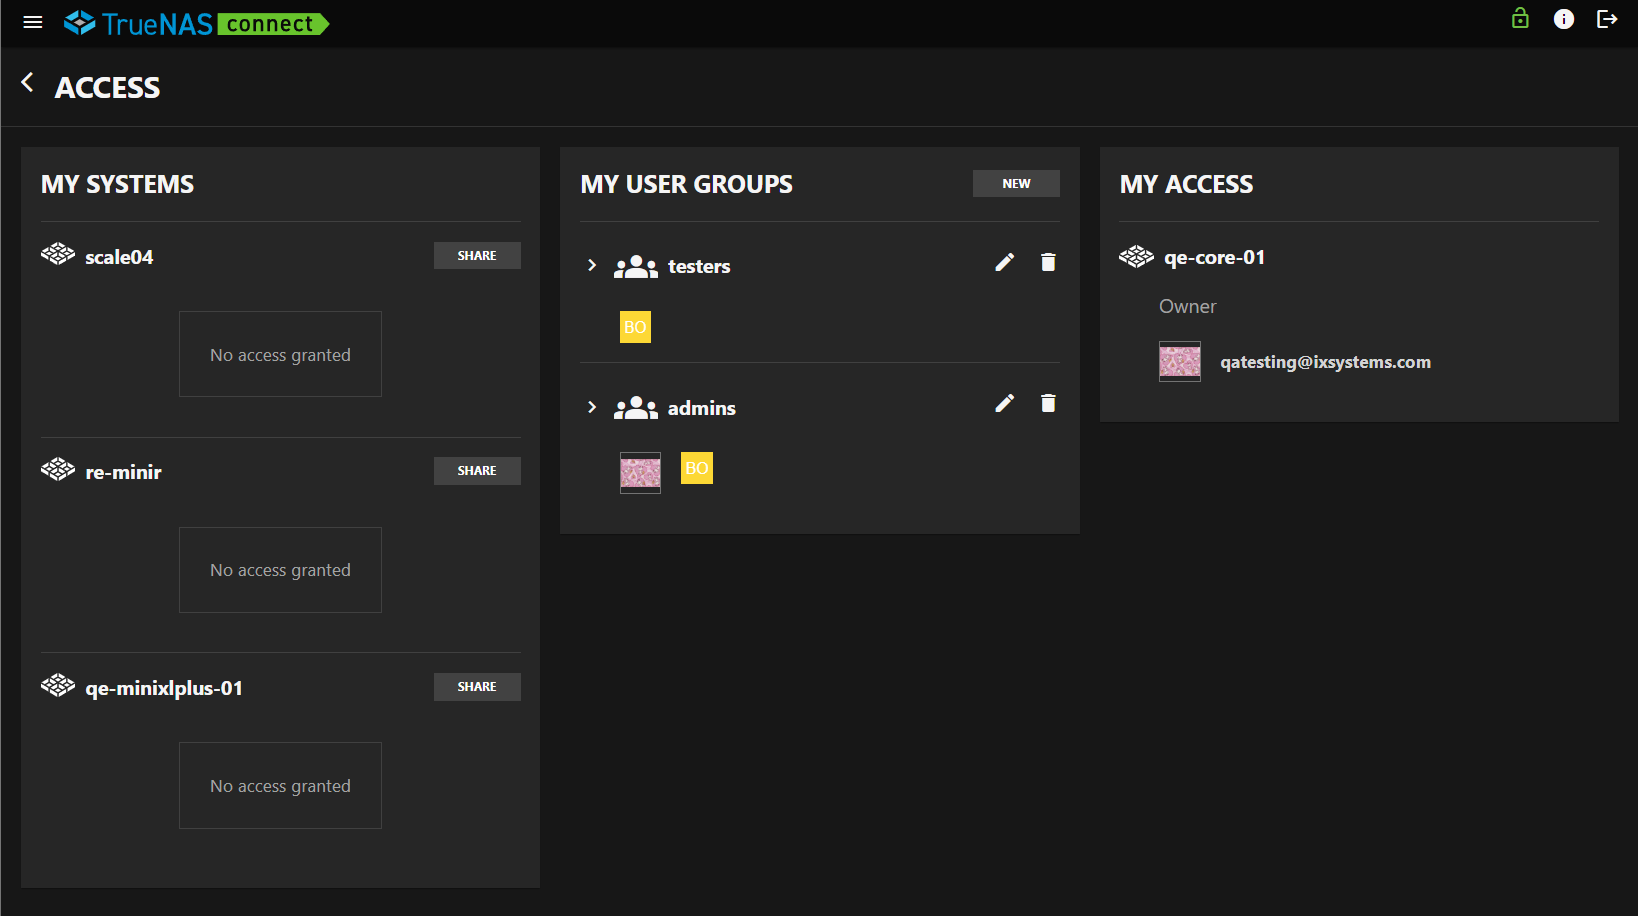
The Access screen shows systems and groups organized in three cards:
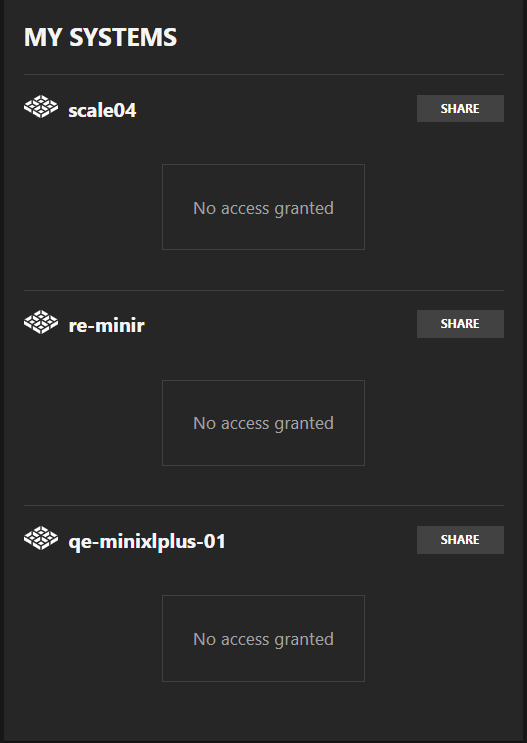
- My Systems - Shows systems in TrueNAS Connect by the logged-in account.
- My User Groups - Shows groups created on in the service by the logged-in account.
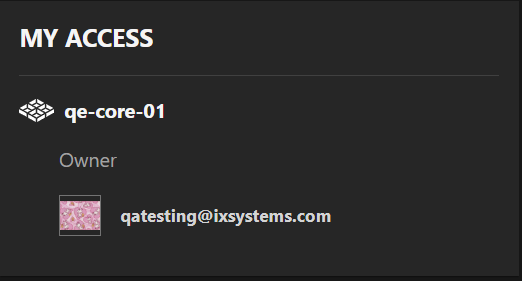
- My Access - Shows systems shared with the logged-in account.
My Systems
The My Systems card shows systems registered by or shared with the logged-in account. Shared systems are those that another TrueNAS Connect user owns or manages and invited the logged-in user to access with shared system or group permissions.
My User Groups
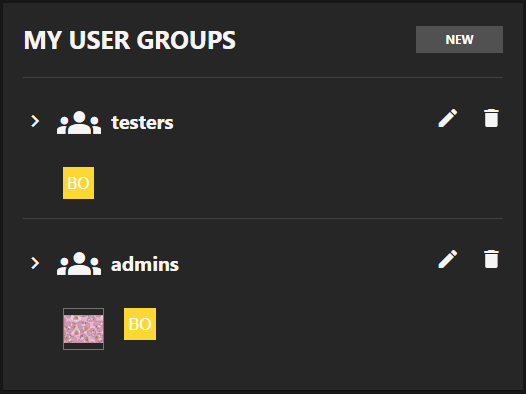
The My User Groups card lists groups added to the user account logged into TrueNAS Connect. It shows the current list of groups and the New button.
Group List Items
The My User Groups card lists individual group items added by the logged-in TrueNAS Connect account. Each listed group item includes an > expand button, the group membership icon, and the name of the group. The expanded view of the group shows the email(s) associated with the group member(s).
Edit opens the Edit Group dialog.
Delete opens the delete confirmation dialog.
Create Group
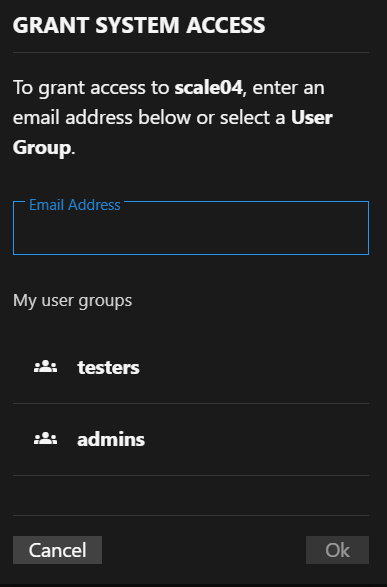
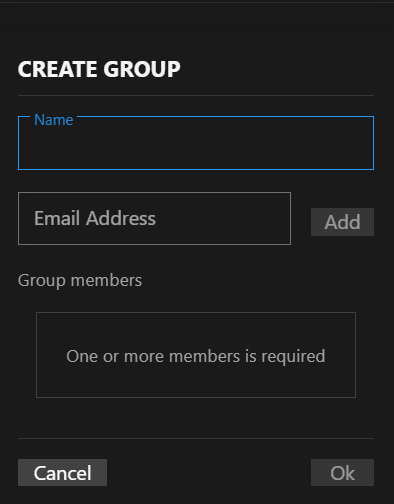
The Create Group dialog includes the Email Address input field and the Group Members area that shows group members added to the group.
Ok saves the changes made, and initiates sending the invitation to the specified email. Cancel closes the dialog without saving or sending the invitation email.
Email Address field
Email Address specifies the email address to which TrueNAS Connect sends the invitation email.
Group Member Items
The Group members area lists the email addresses added to the group, and the Delete icon that opens the delete confirmation dialog.
Edit Group
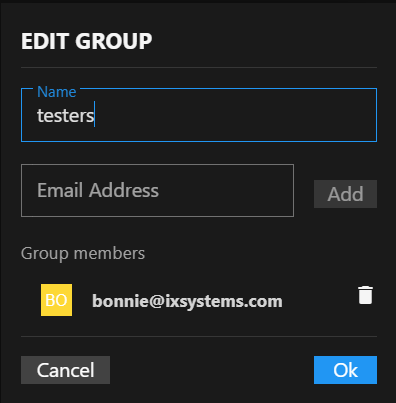
The Edit Group dialog shows the name of the group, the Email Address input field, the Group members area that lists group member email addresses already added to the group, and the Add button. Group members show the Delete icon button.
Ok saves the changes made, and initiates sending the invitation to the specified email. Cancel closes the dialog without saving or sending the invitation email.
Email Address field
Email Address specifies the email address to which TrueNAS Connect sends the invitation email.
Group Member Items
The Group members area lists the email addresses added to the group, and the Delete icon that opens the delete confirmation dialog.
4.2 - Applications Screen
The TrueNAS Connect Applications screen provides centralized management and monitoring for applications, containers, and virtual machines running on connected TrueNAS systems.
Header Controls
The header section contains navigation functionality and displays screen identification.
Apps Section
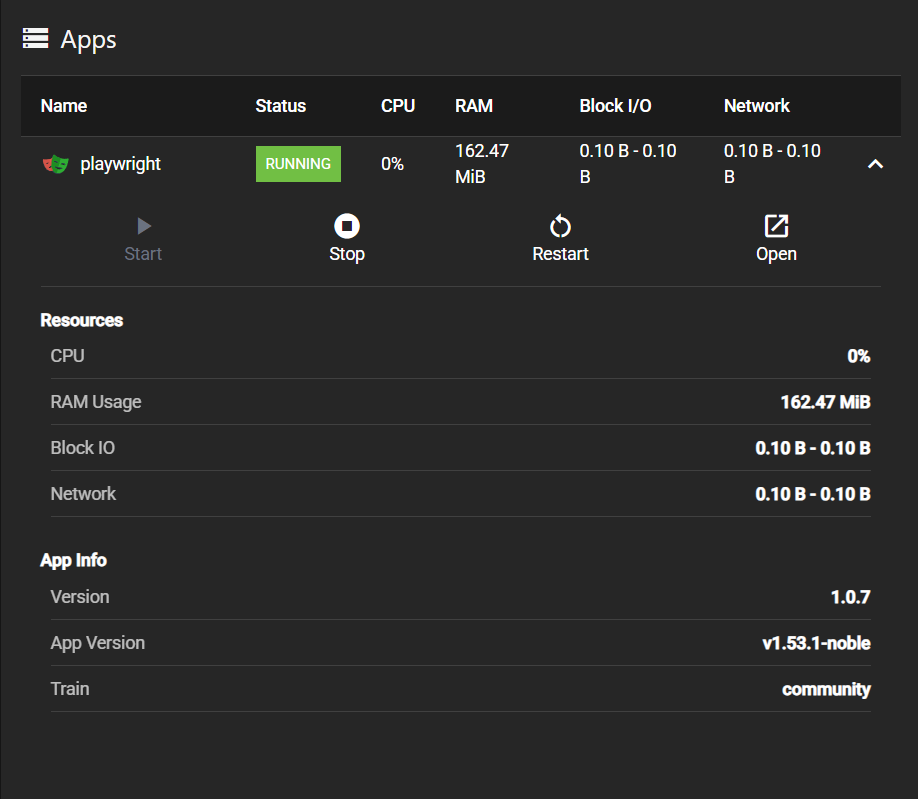
Apps displays and manages installed applications on the TrueNAS system.
Apps Table
Expandable table component displaying all installed applications with the following columns:
- Name: Application name and identifier
- Status: Current operational state of the application
- CPU: Processor utilization percentage
- RAM: Memory consumption in MB or GB
- Block I/O: Storage input/output activity metrics
- Network: Network traffic statistics for the application
The expand button in each table row reveals detailed application information and management options.
Expanded App Details
When an application row is expanded, the App Details section displays comprehensive information and management controls for the selected application.
Application Actions
Action buttons provide direct control of applications:
- Start starts a stopped application (disabled when already running)
- Stop stops a running application
- Restart restarts the application with current configuration
- Open opens the application’s web interface in a new tab
Resources Section
Resources displays real-time performance metrics for the application:
- CPU: Current processor utilization percentage (0%)
- RAM Usage: Memory consumption in MiB or GiB (159.44 MiB)
- Block IO: Storage input/output activity in bytes (0.10 B - 0.10 B)
- Network: Network traffic statistics showing inbound and outbound data (198.00 B - 198.00 B)
Containers Section
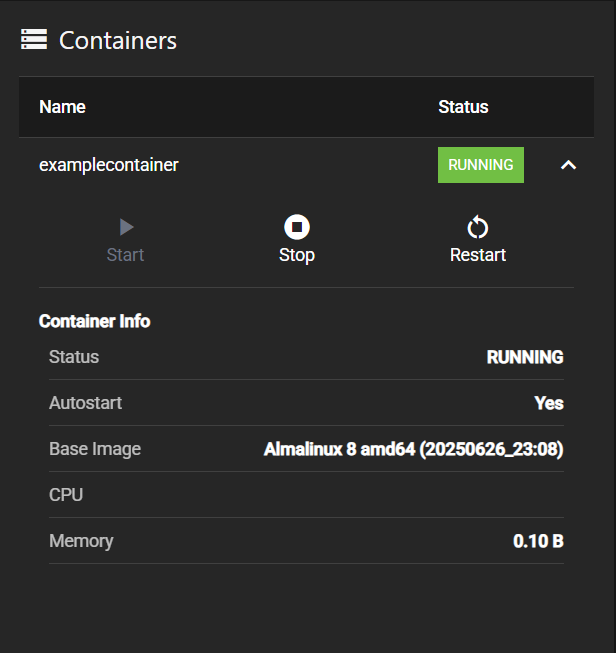
Containers displays and manages Docker containers running on the system.
Expanded Container Details
When a container row is expanded, the Container Details section displays comprehensive information and management controls for the selected container.
Container Actions
Action buttons provide direct control of containers:
- Start starts a stopped container (disabled when already running)
- Stop stops a running container
- Restart restarts the container with current configuration
Container Info Section
Container Info displays container metadata and configuration details:
- Status: Current operational state (RUNNING, ERROR)
- Autostart: Indicates whether the container starts automatically (Yes)
- Base Image: Operating system image and version (Almalinux 8 amd64 (20250626_23:08))
- CPU: Allocated CPU cores or utilization
- Memory: Memory allocation or usage (0.10 B)
Virtual Machines Section
Virtual Machines displays and manages virtual machines configured on the system.
Expanded Virtual Machine Details
When a virtual machine row is expanded, the VM Details section displays comprehensive information and management controls for the selected virtual machine.
Virtual Machine Actions
Action buttons provide direct control of virtual machines:
- Start starts a stopped virtual machine
- Stop stops a running virtual machine
- Restart restarts the virtual machine with current configuration
Virtual Machine Info Section
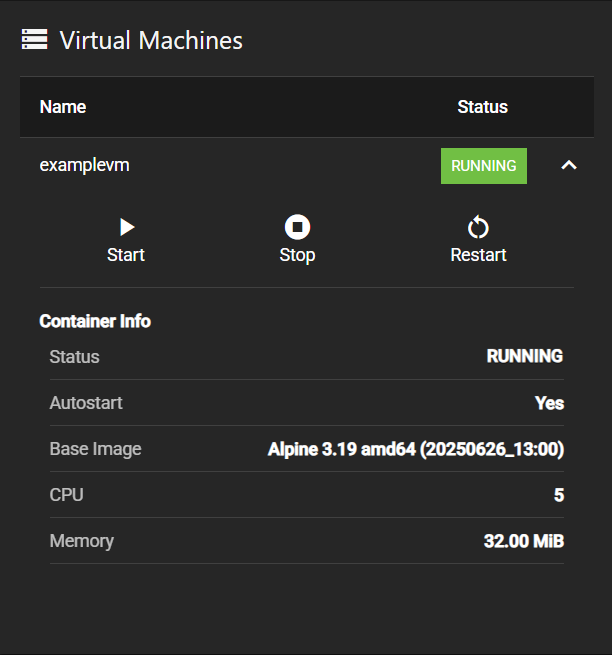
Container Info (note: VMs use the same component as containers) displays virtual machine metadata and configuration details:
- Status: Current operational state (RUNNING, ERROR)
- Autostart: Indicates whether the VM starts automatically (Yes)
- Base Image: Operating system image and version (Alpine 3.19 amd64 (20250626_13:00))
- CPU: Allocated CPU cores (5)
- Memory: Memory allocation (32.00 MiB)
4.3 - Dashboard Screen
Dashboard Screen
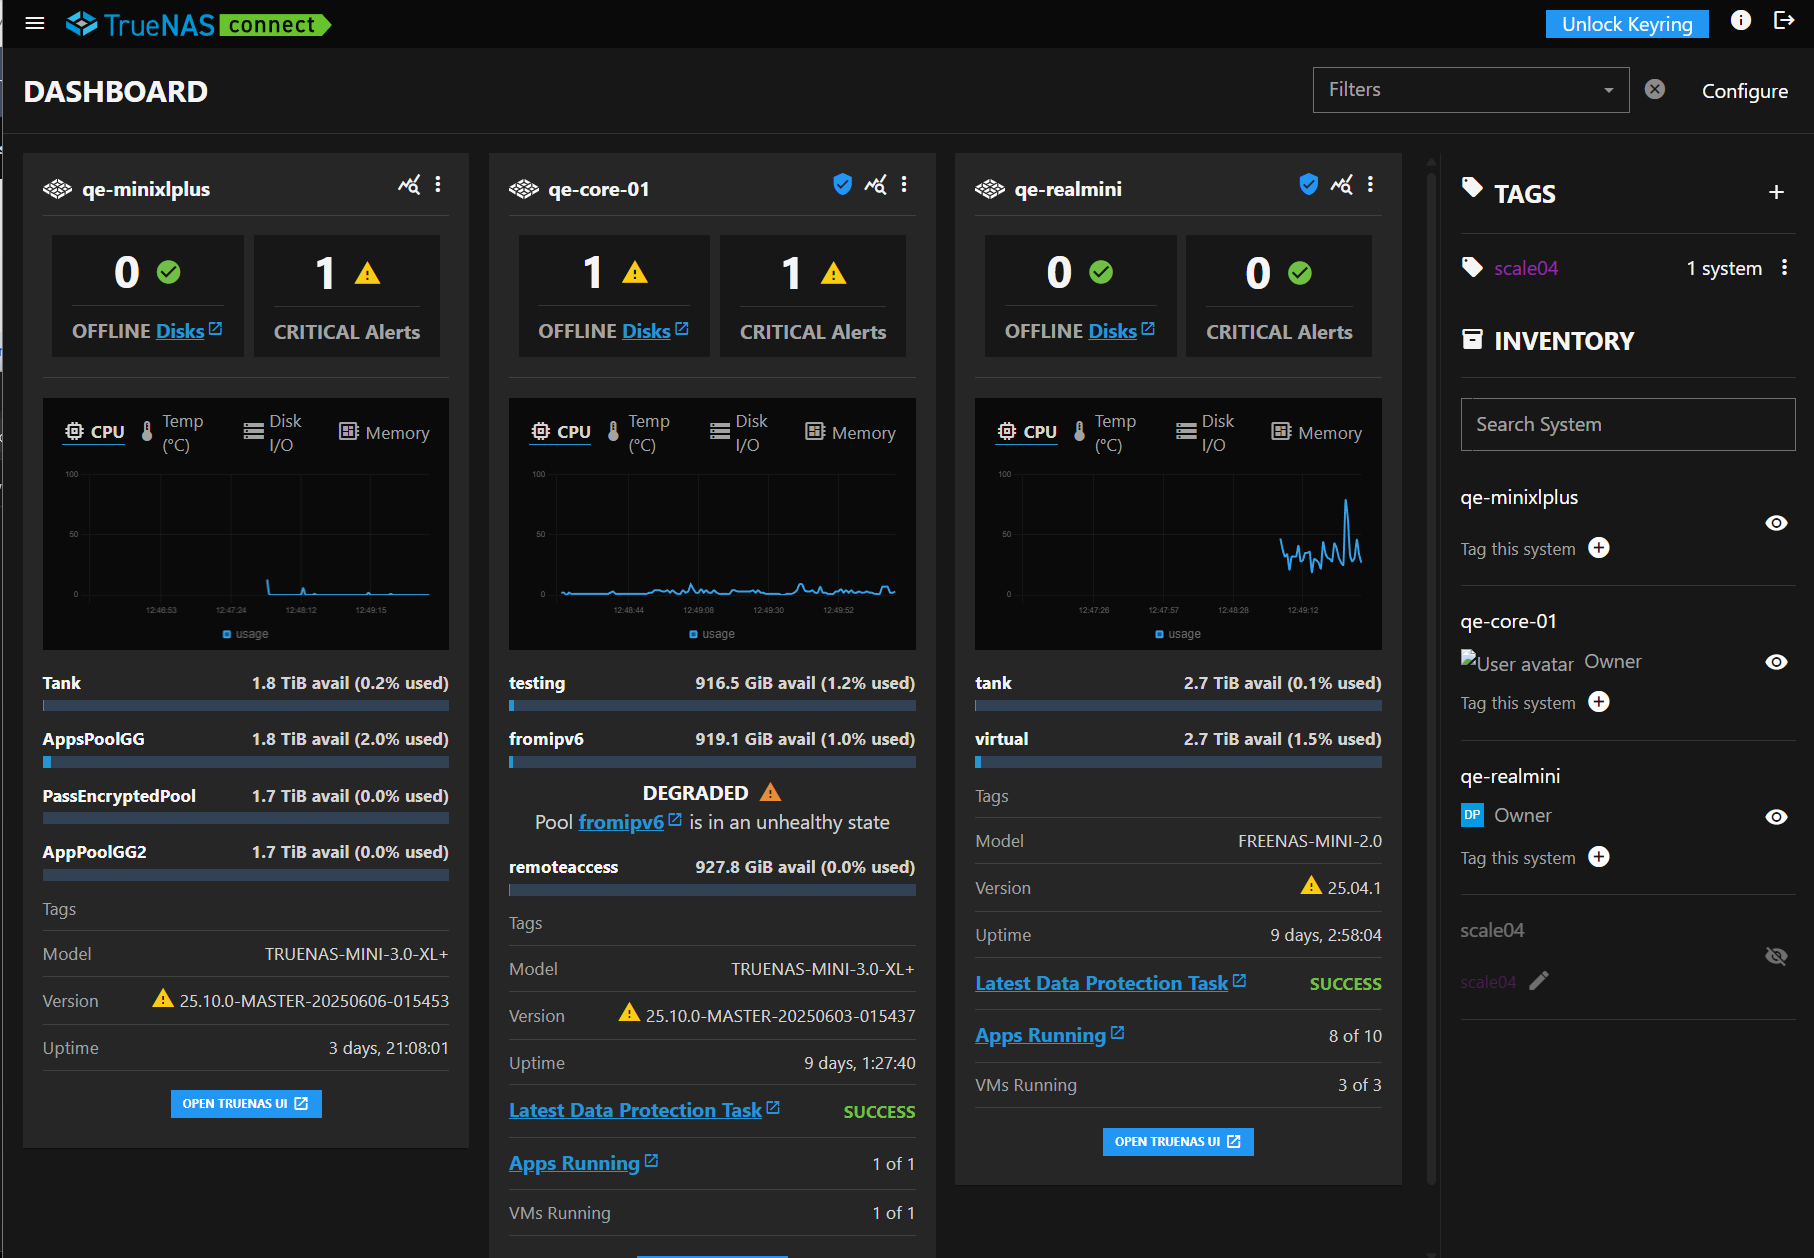
The Dashboard screen shows authentication dialogs and system cards after logging into TrueNAS Connect. After authenticating registered systems, it shows system cards populated with information on and for each system, and a side panel showing Tags and Inventory quick-access lists.
The Dashboard header shows a Filter field and Configure button.
Authentication Dialogs
After signing into TrueNAS Connect, the main Dashboard shows one or more authentication methods:
- Unlock Keyring dialog if a keyring passphrase is added
- System cards with TrueNAS system authentication credentials
After entering the keyring passphrase or TrueNAS system administration credentials, the system information cards show on the Dashboard.
The Add to Keyring option on an unauthenticated system card adds the system to the keyring authentication.
Unlock Keyring Dialog
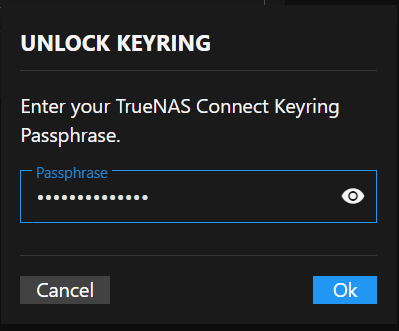
The Unlock Keyring dialog shows when you sign into TrueNAS Connect if you created a keyring to authenticate your registered (added) system.
Passphrase
Passphrase entered unlocks a system added to or covered by the keyring. Adding a keyring creates an API key between the TrueNAS server and TrueNAS Connect. To view the API key, log into the TrueNAS server as an administrator and go to the User API Key screen.
OK submits the passphrase to the system for authentication. A correctly entered passphrase unlocks all systems associated with the authentication keyring. Cancel closes the dialog without submitting the passphrase.
Dashboard Configuration dialog
The Dashboard Configuration dialog shows two options that determine whether Tags and/or Inventory show in the right side panel of the Dashboard screen.
Add System Dialog
The Add System dialog shows on the Dashboard the first time you sign into TrueNAS Connect from a TrueNAS system, and prompts you to complete the system registration.
Version shows the TrueNAS release. Model shows the TrueNAS system model number.
Name
Name specifies a name for the TrueNAS system you register in TrueNAS Connect. Names can include upper and lowercase letters, numbers, and the dash (-) or underscore (_) special characters. Choose a name that helps you remember the TrueNAS system. For example, the host name assigned to the system, the system function (i.e.,backup1), or location of the system (i.e., tn-tnas1).
Confirm adds and registers the TrueNAS system as the name entered. Cancel closes the Add System dialog without adding or registering the TrueNAS system.
Filter
The Filters field at the top of the Dashboard screen shows a dropdown list of filter options. The options narrow a search of systems to those matching the selected options. Filter options are: Online, Offline, Critical Alerts, Updates, and tag names (labels) added to systems in the service.
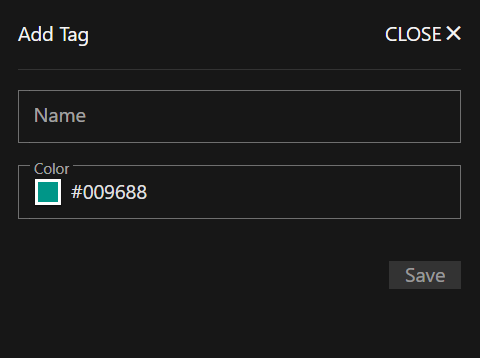
Add Tag
Use the Add Tag form to create a tag (label) in TrueNAS Connect that you can apply to systems. Applying tags to systems labels the systems according to the function, location, or any other useful information you want to use when searching for a system in TrueNAS Connect.
Edit Tag
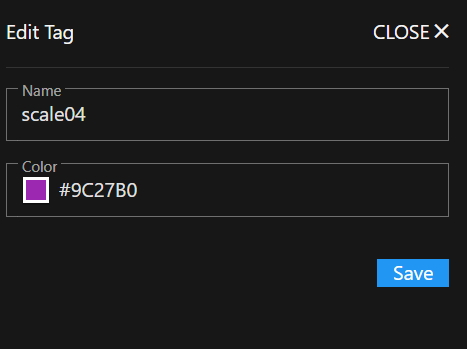
Use the Edit Tag form to change the name or color assigned to a tag (label).
Edit Tag on the menu icon to the right of each tag item opens the Edit Tag form.
Delete Confirmation
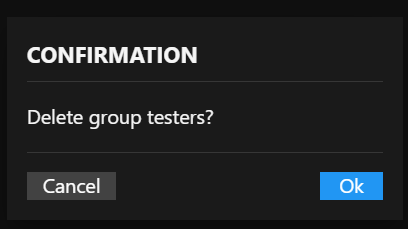
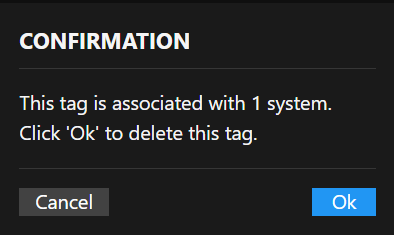
The Confirmation dialog prompts you to verify that you want to delete the selected tag.
Delete on the menu icon to the right of each tag item listed on the Tags screen or in the Tags area in the Dashboard side panel opens the Confirmation dialog.
Ok deletes the tag. Cancel closes the dialog without deleting the tag.
Inventory
Inventory, in the Dashboard right side panel, shows individual system items for systems in TrueNAS Connect.
The add tag icon shows a list of tags added to the system that you can select and assign to the system.
The icon toggles to and back when clicked. It grays out the system item after clicking the icon, and activates it after clicking .
System Cards
System cards show information on disk status, number of critical alerts on the system, a graph with four views (CPU, Temp, Disk I/O, and Memory), information on available storage in system pools, tags applied to the system, the system model number, TrueNAS version on the system, system uptime, and links that open the TrueNAS system screens for data protection tasks, apps, and any VMs running on the system.
Open TrueNAS UI
The Open TrueNAS UI button opens the TrueNAS system main Dashboard screen. Links to the TrueNAS UI open in a new browser tab.
Disk Status
Disk Status shows the health status of system disks, and the Offline Disks links to the TrueNAS UI Disks screen in the TrueNAS UI.
Critical Alerts
Critical Alerts shows the number of critical alerts. When clicked, it opens an alert pane showing the date and time of the critical alert(s).
Realtime Graphs
Realtime Graphs shows four selectable bar graphs.
The default graph is CPU. Each title in the graph shows that graph. The graphs panel includes four graphs:
- CPU - Shows CPU usage over time.
- Temp - Shows the hottest core reading over time.
- Disk I/O - Shows read_bytes and write_bytes in Kilobytes.
- Memory - Shows memory usage over time.
The system information screen, accessed by clicking on the system name, shows more information on the measurements in these graphs.
Pool Graphs
Storage bar graphs show available storage in TiB and the percentage used for each pool. AppsPoolGG and AppPoolGG2 shows storage for applications. PassEncrypted Pool shows storage for any encrypted pools.
System Status and Information
The system status fields at the bottom of the system card:
- Tags - Shows the tag(s) applied to the system.
- Model - Shows the model number for the TrueNAS system.
- Version - Shows the current TrueNAS release for the system, and an update indicator when an update is available.
- Uptime - Shows the days, hours, minutes, and seconds from the last time the system restarted.
System Information Screen
The name of each system added to TrueNAS Connect opens a system information screen.
Each system information card shows four areas:
- System Information
- Network
- Metrics
- Alerts
Links to the TrueNAS UI open in a new browser window.
System Information Area
The System Information link opens the Dashboard screen in the TrueNAS UI.
The system status fields in the System Information area show:
- Tags - The tag(s) applied to the system.
- Model - The model number for the TrueNAS system.
- Version - The current TrueNAS release for the system. An update badge indicates when an update is available for the TrueNAS system.
- Uptime - The days, hours, minutes, and seconds from the last time the TrueNAS system restarted.
Network Area
The Network link opens the Dashboard screen in the TrueNAS UI.
The Network widget shows two fields:
Resolved shows the IP address of the primary network interface card in the TrueNAS system that is registered in TrueNAS Connect.
Metrics Panel
The Metrics panel shows real-time graphs of storage, system, and network resources in the TrueNAS system. Note that running TrueNAS in a virtual environment can lead to incorrect or missing metric reports. This link opens the Reporting screen in the TrueNAS UI.
Pool Graphs
TrueNAS Connect shows graphs for each pool in the TrueNAS system, the status of the pools, storage capacity, percent used, and available storage measured in TiB.
4.4 - Enclosures Screen
The TrueNAS Connect Enclosures screen provides detailed visualization and management of storage enclosures and their disk slots for connected TrueNAS systems.
Header Controls
The header section contains navigation, system selection, and enclosure management controls.
Enclosure Management
The main interface for viewing and managing storage enclosures.
Enclosure Selector
Select Enclosure panel displays available enclosures for the current system. Contains a visual preview of the slot layout and disk status for each enclosure.
Enclosure View
The Enclosure View panel shows detailed enclosure information and controls.
View Mode Controls
The View Mode Controls toggle buttons switch between different enclosure views:
- Healthshows disk health status and diagnostic information.
- Topology shows storage pool and VDEV relationships.
Health Legend
The Health Legend visually relays the status of every disk in the enclosure.
- Online (green) - Disk is online
- Unknown (yellow) - Disk status cannot be determined
- Empty (dashed outline) - No disk installed in slot
Topology Legend
The Topology Legend visually relates drives to the pools they are attached to.
- Pool indicator - A colored dot matching the visual representation for the pool.
- Pool name - The name of the storage pool
Each storage pool is assigned a unique color for easy identification across the enclosure layout.
Enclosure Slots
The Enclosure Slots display a visual grid representation of all disk slots in the enclosure. Each slot displays:
- The current disk name when populated
- A color-coded health status background
- An empty state for available slots
Clicking a slot provides detailed disk information and management options.
Map Enclosure
The TrueNAS Connect Map Enclosure form lets you configure and map new storage enclosures to your TrueNAS system.
Bay Configuration
The configuration form defines the layout and organization of disk slots.
4.5 - Historical Data Screen
Historical Data Screen
The Historical Data screen shows statistical data graphs of system CPU usage and temperature, memory (ARC, physical, and L2ARC), and demand data. The time period these graphs show changes based on the selection in the data picker dialog.
Filter
The Filter field shows the time period for the data shown in the historical statistical charts. The default is Last 1 Hour. After changing the time option, the time period changes to a specific date or a date range.
Export Button
The Export button opens the Export Historical Data dialog.
Export Historical Data
The Export Historical Data dialog exports the statistical data for the selected system in the selected file format.
OK starts the export and closes the dialog. Cancel closes the dialog.
Data Picker Dialog
The data picker dialog opens showing the date options and a calendar.
Date Options
The date options set the time period shown in the historical statistical graphs. Selected option changes the text in the Filter field.
The selectable time period options for statistical data:
- Last 1 Hour - Default time period. The filter field shows this text.
- Today - Shows data for the current calendar date. The filter field shows the current calendar date.
- Yesterday - Shows data for the preceding date. The filter field shows the previous calendar date.
- Custom - Shows data for the date range selected. The filter field shows the date range.
Historical Statistics Graphs
The Historical Data screen shows historical statistical graphs in six categories:
- CPU Usage
- CPU Temperature
- ARC Available Memory
- Physical Memory Available
- L2ARC Access Hit Percentage
- Demand Data Hit Percentage
Data shown in these statistical graphs varies based on the selected option in the Data Picker dialog.
4.6 - Inventory Screen
The TrueNAS Connect Inventory screen provides comprehensive hardware and storage information for all connected TrueNAS systems in your fleet.
Header Controls
The header section contains navigation and export functionality for the inventory data.
Systems Inventory
The main content area displays system identification and hardware information cards for all connected TrueNAS systems.
TrueNAS Connect identifies each system in the inventory by host name.
Mainboard Widget
Mainboard displays hardware specifications for the system motherboard and processor components.
Motherboard
Displays the motherboard model and manufacturer information. Displays Unknown when motherboard details cannot be detected.
CPU Manufacturer
Shows the processor manufacturer (Intel, AMD, etc.). Displays Unknown when manufacturer information is not available.
Storage Widget
Displays detailed information about storage devices and their configuration.
The Storage widget title links to the TrueNAS Storage Dashboard screen for the selected system.
Storage Device Table
Expandable table component displaying all storage devices in the system with the following columns:
- Name: Device identifier (sda, sdb, etc.)
- Size: Storage capacity in TiB or GiB
- Serial: Device serial number for identification
- Pool: ZFS pool assignment for the device
Expand Row Button
The button in each table row expands the row to show detailed device information containing comprehensive disk specifications. The expanded row displays information including disk type, model, transfer mode, rotation rate, HDD standby settings, and advanced power management configuration.
GPU Device Widget
Displays graphics processing unit specifications and availability status.
Description
Complete graphics device description including manufacturer and product family. Example: ASPEED Technology, Inc. ASPEED Graphics Family.
Export Inventory Dialog
The Export button opens the Export Inventory dialog with export options to download inventory information in various formats.
Systems Selection
Multi-select dropdown to choose which TrueNAS systems to include in the inventory export. Displays connected systems by host name (e.g., my-system). Multiple systems can be selected for batch export.
Type Selection
Dropdown to select the scope of inventory data to export:
- Full: Complete comprehensive inventory including system info, detailed hardware specifications, disk information with ZFS pool assignments, GPU details, and technical attributes like physical memory, CPU cores, load averages, and SMART data
- Systems: High-level system information only including system ID, hostname, serial number, TrueNAS version, CPU model, core count, and total memory - ideal for system inventory and asset tracking
- Disks: Storage-focused export containing disk names, models, serial numbers, capacity, type (HDD/SSD), rotation rates, and system association - useful for storage planning and disk management
Format Selection
Dropdown to choose the file format for the exported inventory data:
- JSON: Structured data format suitable for programmatic processing and API integration
- CSV: Comma-separated values format for spreadsheet applications and data analysis
Cancel closes the dialog without performing an export.
Ok executes the inventory export with selected parameters and downloads the resulting file.
4.7 - Keyring Screen
The TrueNAS Connect Keyring screen displays TrueNAS systems and their encrypted key storage status, and allows users to reset the keyring.
Keyring Table
The keyring table displays all TrueNAS systems with stored encrypted keys containing the following columns:
TrueNAS Column
The TrueNAS column displays the host name or identifier of connected TrueNAS systems. The system name shows as it appears in TrueNAS Connect (e.g., my-system).
Reset Keyring Dialog
The Reset Keyring dialog shows a reset warning about keyring reset consequences.
Resetting the keyring permanently removes encryption keys from the database, and users must manually authenticate each TrueNAS server after reset.
Ok proceeds with keyring reset and removes all encrypted keys from the database. Cancel closes the reset dialog without resetting the key and returns to the Keyring screen.
Create Keyring Passphrase Dialog
The Create Keyring button opens the Create Keyring Passphrase dialog for setting up encrypted API key storage.
The dialog explains that the keyring provides quick authentication for TrueNAS servers by creating and encrypting API keys client-side using a passphrase.
The dialog recommends using a passphrase different from your TrueNAS user password and suggests strong passphrases should be at least 16 characters long with a mix of uppercase letters, lowercase letters, numbers, and special characters.
Unlock Keyring Dialog
The Unlock Keyring dialog shows when you sign into TrueNAS Connect if you created a keyring to authenticate your registered (added) system.
Passphrase
Passphrase entered unlocks a system added to or covered by the keyring. Adding a keyring creates an API key between the TrueNAS server and TrueNAS Connect. To view the API key, log into the TrueNAS server as an administrator and go to the User API Key screen.
OK submits the passphrase to the system for authentication. A correctly entered passphrase unlocks all systems associated with the authentication keyring. Cancel closes the dialog without submitting the passphrase.
4.8 - Notification Tasks Screen
The TrueNAS Connect Notification Tasks screen provides centralized configuration and management of automated notification tasks that monitor connected TrueNAS systems and send alerts based on specified criteria.
Header Controls
The header section contains navigation, help access, and task creation functionality.
Notification Tasks Table
The main content displays notification tasks in a sortable table with configuration details and management actions.
Tasks Table
Sortable table component displaying all configured notification tasks with the following columns:
- Systems: Target TrueNAS system names (examplesystem)
- Tags: Associated system tags for grouping notifications
- Type: Notification type (Alert, Report)
- Schedule: Notification frequency (Hourly, Immediately)
- Method: Notification delivery method with icon (Email )
- Threshold: Alert severity level with color coding (INFO, CRITICAL)
- Enabled: Toggle switch showing task activation status
Each column header includes sort functionality with arrow indicators.
Enabled Toggle
Enabled slide toggle controls whether the notification task actively monitors and sends alerts. Toggle shows checkmark when enabled, dash when disabled.
Task Actions
Action buttons provide task management functionality:
- Test sends a test notification using the configured method
- Duplicate creates a copy of the task with the same settings
- Edit opens the Edit Notification Task panel
- Delete removes the notification task permanently
Add Notification Task Panel
The Add Notification Task panel provides form fields for creating new notification tasks.
Systems / Tags Field
Systems / Tags multi-select dropdown specifies target systems or system groups for monitoring. This is a required field with validation indicators.
Notification Type Field
Notification Type radio button selection determines the notification behavior:
- Alert: Sends notifications when alert conditions are triggered based on threshold settings
- Report: Sends automated reports containing system performance data, storage usage trends, alert summaries, and predictive analysis
Schedule Field
Schedule Set notification frequency based on type:
Alert notifications:
- Immediately: Send notifications as events occur
- Hourly, Daily, Weekly, Monthly: Aggregate and send notifications at specified intervals
Report notifications:
- Hourly, Daily, Weekly: Schedule automated report delivery
Threshold Field
Threshold dropdown sets minimum alert severity level:
For Alert notifications:
- Critical: Only critical system issues
- Error: Error-level alerts and above
- Warning: Warning-level alerts and above
- Info: All informational messages and above
For Report notifications: Determines the minimum alert level to include in alert history summaries within automated reports.
Edit Notification Task Panel
The Edit Notification Task panel allows modification of existing notification task settings.
Edit Form
Same form component as Add Notification Task panel, pre-populated with current task settings.
Notification Task Details Panel
The Notification Task Details panel displays comprehensive information and management controls for selected tasks.
Detail Actions
Action buttons provide task management functionality and are available on the right side of each entry in the Notification Tasks table:
- Test sends a test notification using the task configuration
- Duplicate creates a copy of the task
- Edit opens the edit panel for the task
- Delete permanently removes the notification task
Details Section
Details displays complete task configuration:
- Systems: Target system names (examplesystem)
- Tags: Associated system tags (empty if none)
- Type: Notification type (Alert or Report)
- Schedule: Notification timing (Hourly)
- Method: Delivery mechanism (Email)
- Threshold: Alert severity level with color coding (INFO)
- Enabled: Activation status (true)
4.9 - Profile Screen
The TrueNAS Connect Profile screen provides user information, avatar settings, and account deletion options.
Profile Information
The main content area displays user account information and avatar management options.
Information Form
The Information section displays user account details in form fields.
Email Address
Displays the user’s email address associated with the TrueNAS Connect account. The field is disabled and shows the email used for account authentication.
Avatar
The Avatar section manages the user profile image.
The image area displays the current avatar image or a default person icon when no avatar is set.
Choose Avatar opens a file selection dialog to upload a new profile image.
The uploader accepts image files in JPG, PNG, and WebP formats.
The button deletes the current avatar and restores the default image.
Delete Account Dialog
The Delete button opens a confirmation dialog explaining the consequences of account deletion.
The confirmation dialog displays warnings about permanent account deletion consequences. Deleting your TrueNAS Connect account results in:
- Deletion of your encrypted keyring: All stored encryption keys are permanently removed
- Termination of your TrueNAS registrations: Systems are no longer registered with TrueNAS Connect
- Certificates will no longer renew automatically: SSL/TLS certificates require manual renewal
4.10 - Tags Screen
4.11 - Top Toolbar
Top Toolbar
The top toolbar shows at the top of all TrueNAS Connect screens.
It provides access to the main navigation menu and three buttons:
About Dialog
The TrueNAS Connect (About) dialog shows the build date, build commit, and build tag for the service.
Build date shows the calendar month, day, year, and time of the current build of the service.
Build commit shows the commit hash assigned to the current build in GitHub.
Build tag shows the current version of the service.
The content_copy (copy to clipboard) icon copies all the build information to the clipboard and shows a message at the top of the screen confirming the action occurred.
Download Logs downloads the TrueNAS Connect logs for troubleshooting purposes.
Ok closes the dialog.


